| Red | Green | Blue | |
| z | 17.63 | ||
| znorm | Inf | ||
| sky | -NaN | -NaN | -Inf |
| S/N | 31.0 | 51.0 | 55.7 |
| S/N(c) | 23.0 | 30.2 | 20.6 |
| SN(E/C) |

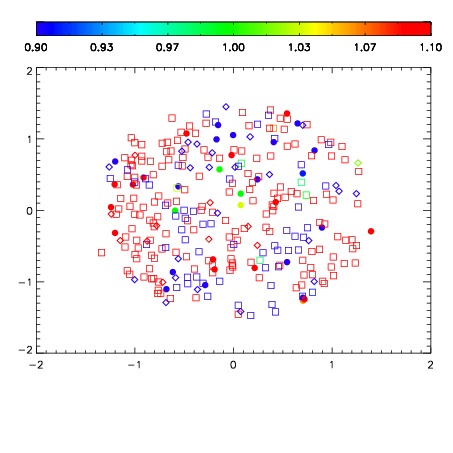
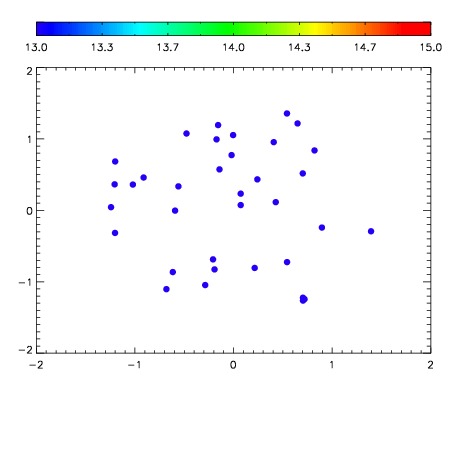

| Frame | Nreads | Zeropoints | Mag plots | Spatial mag deviation | Spatial sky 16325A emission deviations (filled: sky, open: star) | Spatial sky continuum emission | Spatial sky telluric CO2 absorption deviations (filled: H < 10) | |||||||||||||||||||||||
| 0 | 0 |
|
|
|
|
|
|
| IPAIR | NAME | SHIFT | NEWSHIFT | S/N | NAME | SHIFT | NEWSHIFT | S/N |
| 0 | 12000035 | 0.503432 | 0.00000 | 19.0153 | 12000037 | -0.00148568 | 0.504918 | 18.9020 |
| 1 | 12000034 | 0.503083 | 0.000348985 | 19.0735 | 12000033 | 0.00000 | 0.503432 | 19.0383 |
| 2 | 12000039 | 0.503018 | 0.000413954 | 18.7343 | 12000036 | -0.000966011 | 0.504398 | 18.8496 |
| 3 | 12000038 | 0.502795 | 0.000636995 | 18.7010 | 12000040 | -0.000456783 | 0.503889 | 18.6592 |