| Red | Green | Blue | |
| z | 17.64 | ||
| znorm | Inf | ||
| sky | -Inf | -Inf | -NaN |
| S/N | 24.3 | 40.2 | 43.3 |
| S/N(c) | 21.9 | 27.7 | 19.1 |
| SN(E/C) |
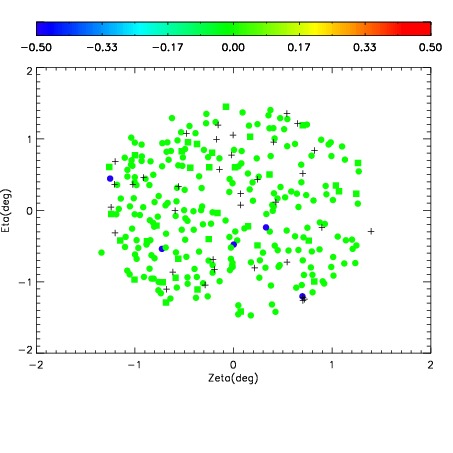
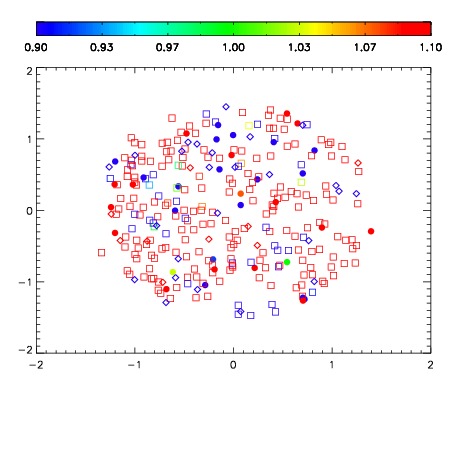
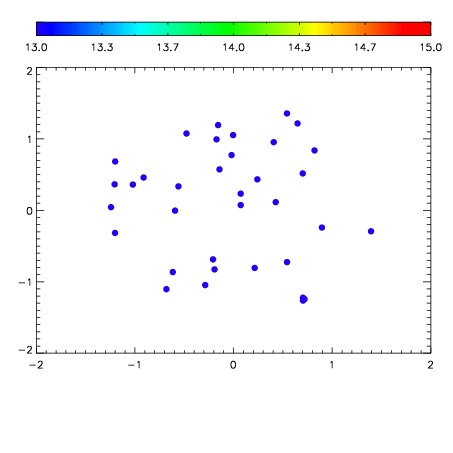

| Frame | Nreads | Zeropoints | Mag plots | Spatial mag deviation | Spatial sky 16325A emission deviations (filled: sky, open: star) | Spatial sky continuum emission | Spatial sky telluric CO2 absorption deviations (filled: H < 10) | |||||||||||||||||||||||
| 0 | 0 |
|
|
|
|
|
|
| IPAIR | NAME | SHIFT | NEWSHIFT | S/N | NAME | SHIFT | NEWSHIFT | S/N |
| 0 | 12090051 | 0.496348 | 0.00000 | 18.7760 | 12090049 | 0.00000 | 0.496348 | 18.7645 |
| 1 | 12090055 | 0.494684 | 0.00166398 | 18.8776 | 12090056 | 0.00103895 | 0.495309 | 18.8911 |
| 2 | 12090050 | 0.496034 | 0.000313997 | 18.8299 | 12090053 | -0.000318165 | 0.496666 | 18.7926 |
| 3 | 12090054 | 0.495375 | 0.000972986 | 18.8176 | 12090052 | -0.000511560 | 0.496860 | 18.7907 |