| Red | Green | Blue | |
| z | 17.64 | ||
| znorm | Inf | ||
| sky | -Inf | -Inf | -Inf |
| S/N | 17.3 | 32.0 | 33.7 |
| S/N(c) | 13.4 | 23.5 | 25.0 |
| SN(E/C) |
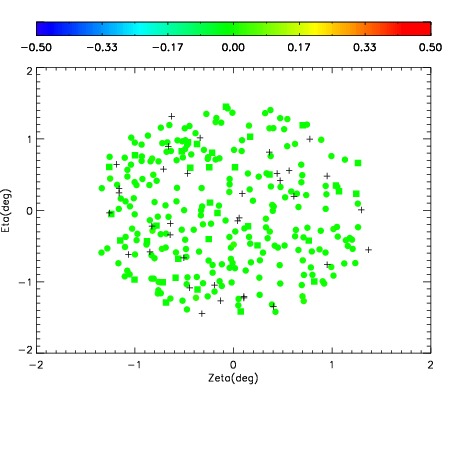
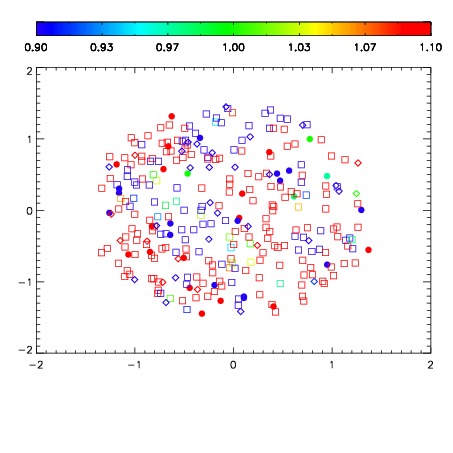
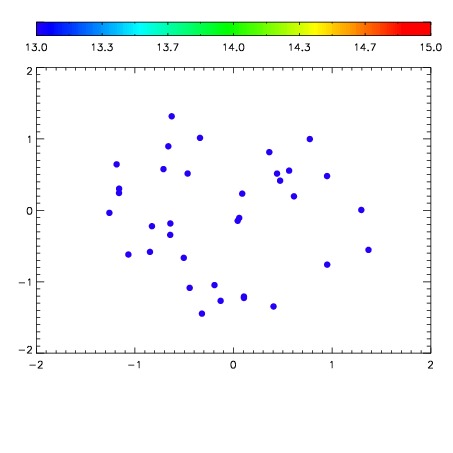

| Frame | Nreads | Zeropoints | Mag plots | Spatial mag deviation | Spatial sky 16325A emission deviations (filled: sky, open: star) | Spatial sky continuum emission | Spatial sky telluric CO2 absorption deviations (filled: H < 10) | |||||||||||||||||||||||
| 0 | 0 |
|
|
|
|
|
|
| IPAIR | NAME | SHIFT | NEWSHIFT | S/N | NAME | SHIFT | NEWSHIFT | S/N |
| 0 | 12280028 | 0.499512 | 0.00000 | 17.4495 | 12280029 | 0.00427007 | 0.495242 | 17.1664 |
| 1 | 12280023 | 0.498752 | 0.000759989 | 18.4685 | 12280022 | 0.00000 | 0.499512 | 18.4608 |
| 2 | 12280024 | 0.498982 | 0.000529975 | 18.2189 | 12280025 | 0.00127336 | 0.498239 | 18.4058 |
| 3 | 12280027 | 0.498416 | 0.00109598 | 17.7345 | 12280026 | 0.000503524 | 0.499008 | 18.2506 |