| Red | Green | Blue | |
| z | 17.65 | ||
| znorm | Inf | ||
| sky | -Inf | -Inf | -Inf |
| S/N | 15.3 | 25.9 | 29.6 |
| S/N(c) | 14.3 | 0.2 | 28.3 |
| SN(E/C) |
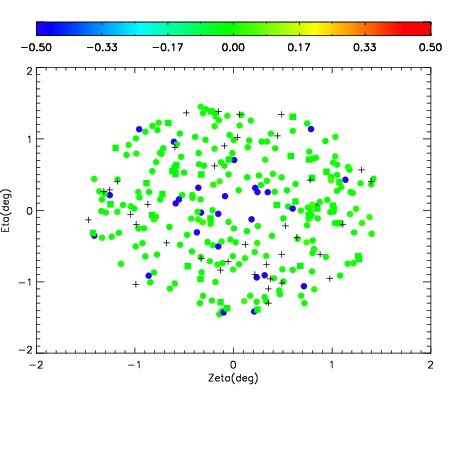
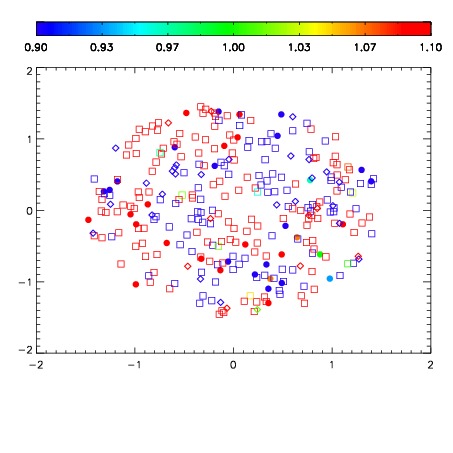


| Frame | Nreads | Zeropoints | Mag plots | Spatial mag deviation | Spatial sky 16325A emission deviations (filled: sky, open: star) | Spatial sky continuum emission | Spatial sky telluric CO2 absorption deviations (filled: H < 10) | |||||||||||||||||||||||
| 0 | 0 |
|
|
|
|
|
|
| IPAIR | NAME | SHIFT | NEWSHIFT | S/N | NAME | SHIFT | NEWSHIFT | S/N |
| 0 | 11970050 | 0.502353 | 0.00000 | 17.2879 | 11970051 | -0.00182392 | 0.504177 | 17.2602 |
| 1 | 11970049 | 0.502119 | 0.000234008 | 18.2740 | 11970048 | -0.00282006 | 0.505173 | 18.2603 |
| 2 | 11970046 | 0.501776 | 0.000577033 | 18.0736 | 11970047 | -0.00214832 | 0.504501 | 18.2101 |
| 3 | 11970045 | 0.501950 | 0.000402987 | 17.8668 | 11970044 | 0.00000 | 0.502353 | 17.6270 |