| Red | Green | Blue | |
| z | 17.64 | ||
| znorm | Inf | ||
| sky | -Inf | -Inf | -Inf |
| S/N | 18.0 | 30.8 | 33.6 |
| S/N(c) | 17.0 | 0.2 | 29.4 |
| SN(E/C) |
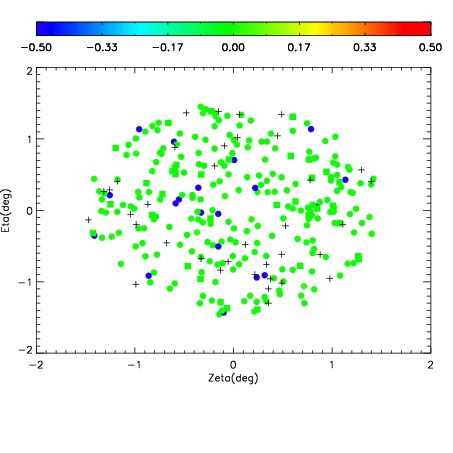
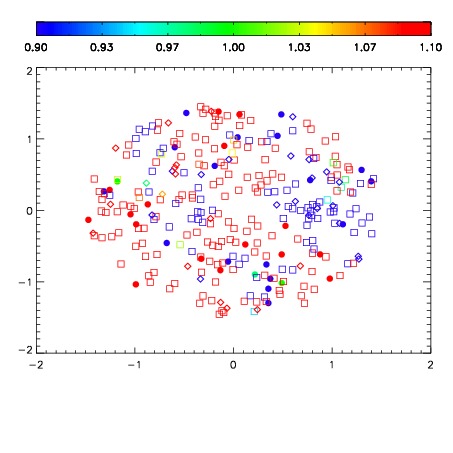
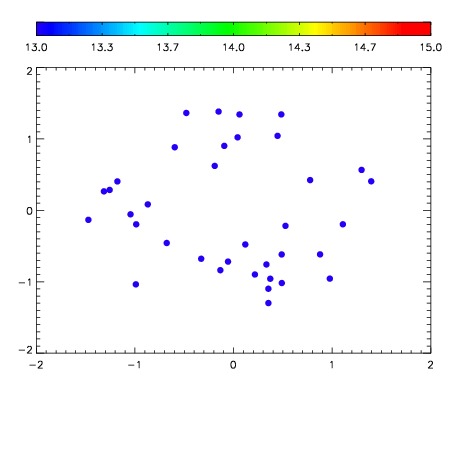

| Frame | Nreads | Zeropoints | Mag plots | Spatial mag deviation | Spatial sky 16325A emission deviations (filled: sky, open: star) | Spatial sky continuum emission | Spatial sky telluric CO2 absorption deviations (filled: H < 10) | |||||||||||||||||||||||
| 0 | 0 |
|
|
|
|
|
|
| IPAIR | NAME | SHIFT | NEWSHIFT | S/N | NAME | SHIFT | NEWSHIFT | S/N |
| 0 | 12030032 | 0.502932 | 0.00000 | 17.9048 | 12030033 | 0.000656869 | 0.502275 | 17.7001 |
| 1 | 12030027 | 0.502417 | 0.000514984 | 18.1169 | 12030026 | 0.00000 | 0.502932 | 18.1098 |
| 2 | 12030031 | 0.502530 | 0.000402033 | 18.0170 | 12030030 | -0.000163872 | 0.503096 | 17.8037 |
| 3 | 12030028 | 0.502645 | 0.000286996 | 17.8121 | 12030029 | -0.000307037 | 0.503239 | 17.6515 |