| Red | Green | Blue | |
| z | 17.64 | ||
| znorm | Inf | ||
| sky | -NaN | -Inf | -NaN |
| S/N | 32.3 | 51.6 | 57.6 |
| S/N(c) | 32.2 | 0.4 | 51.5 |
| SN(E/C) |
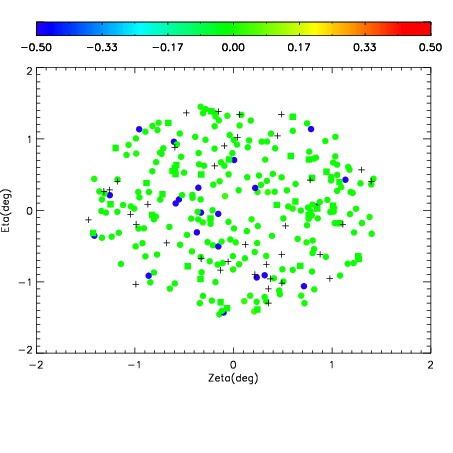
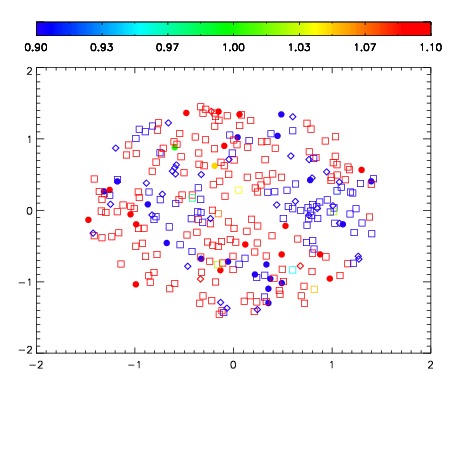
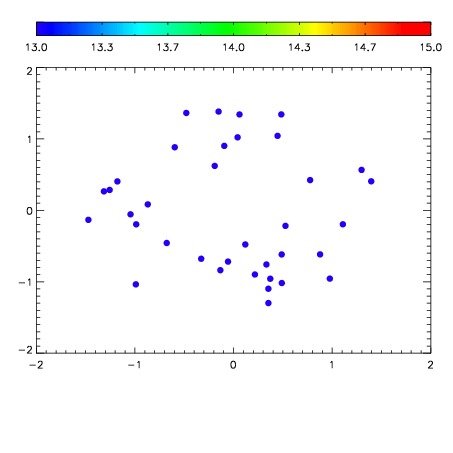

| Frame | Nreads | Zeropoints | Mag plots | Spatial mag deviation | Spatial sky 16325A emission deviations (filled: sky, open: star) | Spatial sky continuum emission | Spatial sky telluric CO2 absorption deviations (filled: H < 10) | |||||||||||||||||||||||
| 0 | 0 |
|
|
|
|
|
|
| IPAIR | NAME | SHIFT | NEWSHIFT | S/N | NAME | SHIFT | NEWSHIFT | S/N |
| 0 | 12240024 | 0.491531 | 0.00000 | 18.9716 | 12240029 | -0.000728251 | 0.492259 | 18.9364 |
| 1 | 12240023 | 0.491439 | 9.19998e-05 | 19.0071 | 12240022 | 0.00000 | 0.491531 | 18.9956 |
| 2 | 12240028 | 0.491456 | 7.50124e-05 | 18.8624 | 12240026 | -0.00128870 | 0.492820 | 18.8155 |
| 3 | 12240027 | 0.490918 | 0.000613004 | 18.8383 | 12240025 | -0.00101479 | 0.492546 | 18.8068 |