| Red | Green | Blue | |
| z | 17.63 | ||
| znorm | Inf | ||
| sky | -Inf | -Inf | -Inf |
| S/N | 36.0 | 56.7 | 63.7 |
| S/N(c) | 34.5 | 0.4 | 54.4 |
| SN(E/C) |
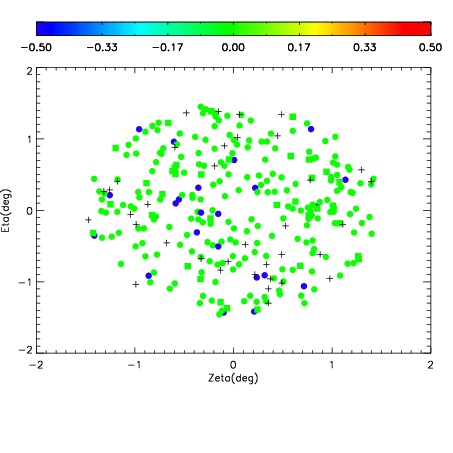
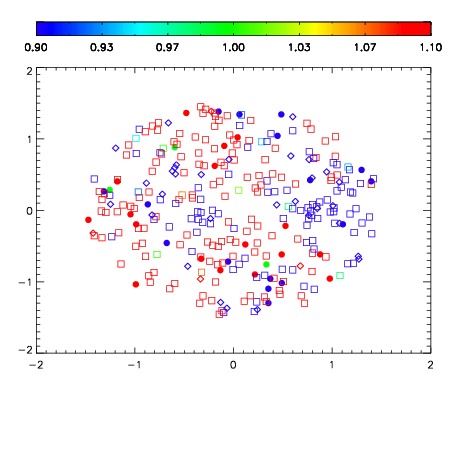
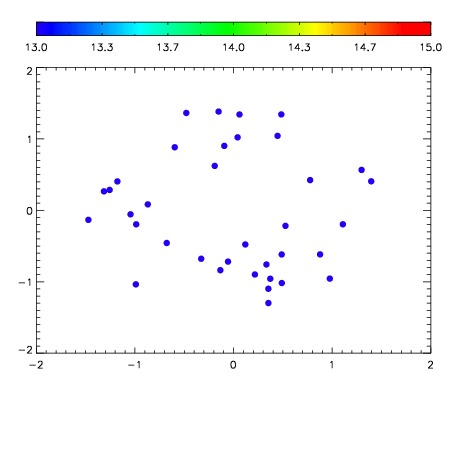

| Frame | Nreads | Zeropoints | Mag plots | Spatial mag deviation | Spatial sky 16325A emission deviations (filled: sky, open: star) | Spatial sky continuum emission | Spatial sky telluric CO2 absorption deviations (filled: H < 10) | |||||||||||||||||||||||
| 0 | 0 |
|
|
|
|
|
|
| IPAIR | NAME | SHIFT | NEWSHIFT | S/N | NAME | SHIFT | NEWSHIFT | S/N |
| 0 | 12320017 | 0.488626 | 0.00000 | 18.9294 | 12320011 | 0.00000 | 0.488626 | 18.9467 |
| 1 | 12320013 | 0.487182 | 0.00144401 | 18.9993 | 12320015 | 0.000613499 | 0.488012 | 19.0325 |
| 2 | 12320012 | 0.486887 | 0.00173900 | 18.9841 | 12320014 | 0.00102283 | 0.487603 | 18.9973 |
| 3 | 12320016 | 0.488550 | 7.59959e-05 | 18.9037 | 12320018 | 0.000253113 | 0.488373 | 18.9430 |