| Red | Green | Blue | |
| z | 17.64 | ||
| znorm | Inf | ||
| sky | -Inf | -Inf | -Inf |
| S/N | 21.3 | 36.5 | 40.8 |
| S/N(c) | 23.9 | 0.3 | 76.3 |
| SN(E/C) |
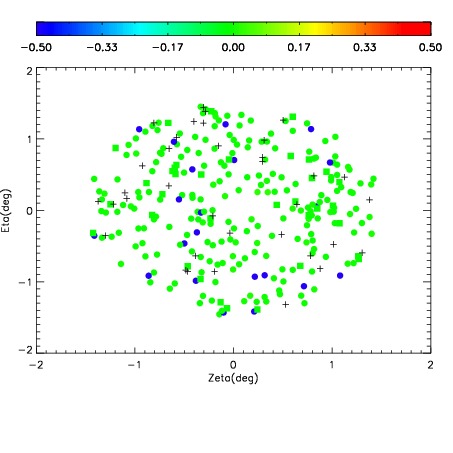
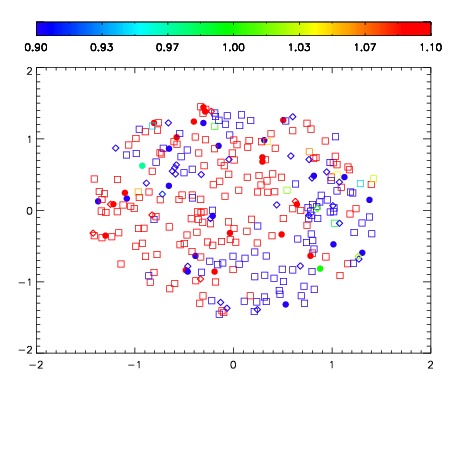
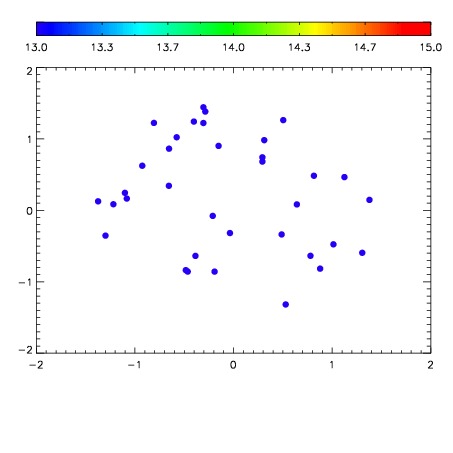

| Frame | Nreads | Zeropoints | Mag plots | Spatial mag deviation | Spatial sky 16325A emission deviations (filled: sky, open: star) | Spatial sky continuum emission | Spatial sky telluric CO2 absorption deviations (filled: H < 10) | |||||||||||||||||||||||
| 0 | 0 |
|
|
|
|
|
|
| IPAIR | NAME | SHIFT | NEWSHIFT | S/N | NAME | SHIFT | NEWSHIFT | S/N |
| 0 | 12030039 | 0.502172 | 0.00000 | 18.6738 | 12030040 | 0.000400436 | 0.501772 | 18.6712 |
| 1 | 12030038 | 0.501862 | 0.000310004 | 18.7061 | 12030037 | 0.00000 | 0.502172 | 18.6714 |
| 2 | 12030043 | 0.501010 | 0.00116199 | 18.3091 | 12030041 | 0.000234720 | 0.501937 | 18.6004 |
| 3 | 12030042 | 0.500798 | 0.00137401 | 18.2125 | 12030044 | -0.000553563 | 0.502726 | 18.4229 |