| Red | Green | Blue | |
| z | 17.64 | ||
| znorm | Inf | ||
| sky | -Inf | -Inf | -NaN |
| S/N | 8.7 | 18.7 | 20.3 |
| S/N(c) | 9.8 | 0.1 | 19.4 |
| SN(E/C) |
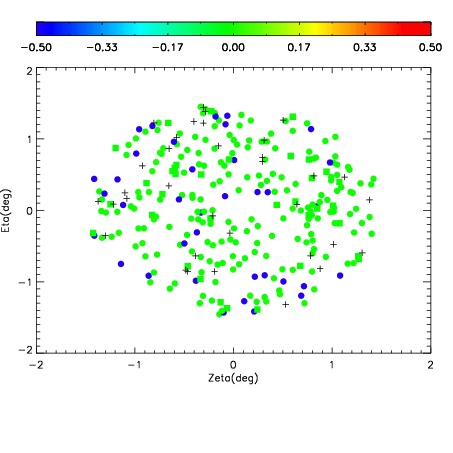
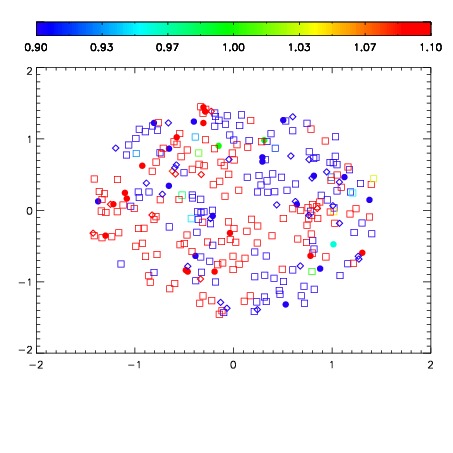
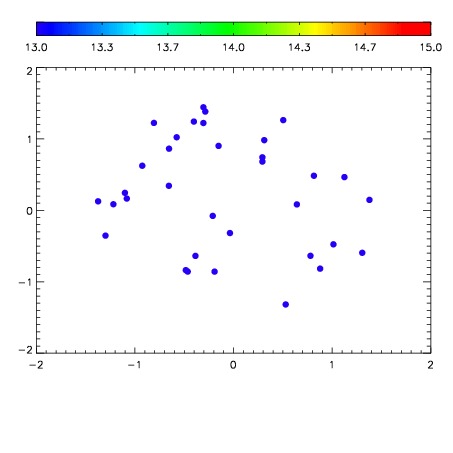

| Frame | Nreads | Zeropoints | Mag plots | Spatial mag deviation | Spatial sky 16325A emission deviations (filled: sky, open: star) | Spatial sky continuum emission | Spatial sky telluric CO2 absorption deviations (filled: H < 10) | |||||||||||||||||||||||
| 0 | 0 |
|
|
|
|
|
|
| IPAIR | NAME | SHIFT | NEWSHIFT | S/N | NAME | SHIFT | NEWSHIFT | S/N |
| 0 | 12260023 | 0.492191 | 0.00000 | 17.3145 | 12260025 | -0.00339548 | 0.495586 | 17.3024 |
| 1 | 12260027 | 0.491036 | 0.00115499 | 17.3430 | 12260026 | -0.00284337 | 0.495034 | 17.3669 |
| 2 | 12260028 | 0.491389 | 0.000801980 | 17.3423 | 12260022 | 0.00000 | 0.492191 | 17.3277 |
| 3 | 12260024 | 0.492044 | 0.000146985 | 17.3260 | 12260029 | 0.000164460 | 0.492027 | 17.3276 |