| Red | Green | Blue | |
| z | 17.64 | ||
| znorm | Inf | ||
| sky | -Inf | -Inf | -NaN |
| S/N | 31.0 | 49.1 | 57.3 |
| S/N(c) | 31.0 | 0.4 | 94.8 |
| SN(E/C) |
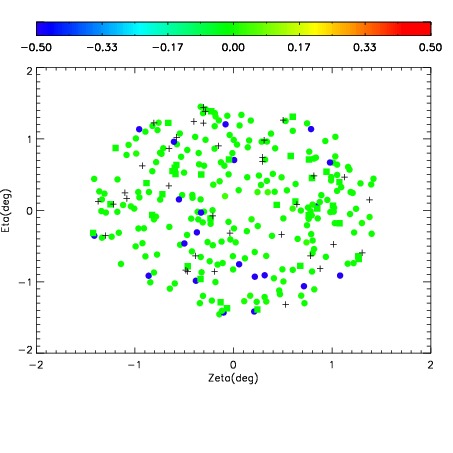
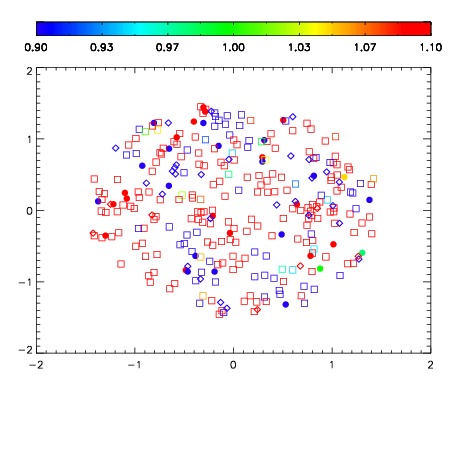
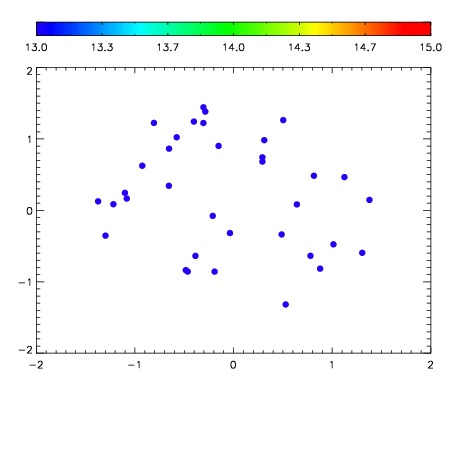

| Frame | Nreads | Zeropoints | Mag plots | Spatial mag deviation | Spatial sky 16325A emission deviations (filled: sky, open: star) | Spatial sky continuum emission | Spatial sky telluric CO2 absorption deviations (filled: H < 10) | |||||||||||||||||||||||
| 0 | 0 |
|
|
|
|
|
|
| IPAIR | NAME | SHIFT | NEWSHIFT | S/N | NAME | SHIFT | NEWSHIFT | S/N |
| 0 | 12310028 | 0.495356 | 0.00000 | 19.0650 | 12310029 | -0.00218445 | 0.497540 | 19.0403 |
| 1 | 12310024 | 0.494813 | 0.000542998 | 19.1183 | 12310025 | -0.00180864 | 0.497165 | 19.0820 |
| 2 | 12310023 | 0.494508 | 0.000847995 | 19.0954 | 12310022 | 0.00000 | 0.495356 | 19.0749 |
| 3 | 12310027 | 0.494737 | 0.000618994 | 19.0521 | 12310026 | -0.00155559 | 0.496912 | 19.0331 |