| Red | Green | Blue | |
| z | 17.64 | ||
| znorm | Inf | ||
| sky | -Inf | -NaN | -Inf |
| S/N | 7.2 | 15.9 | 15.6 |
| S/N(c) | 11.9 | 19.1 | 0.2 |
| SN(E/C) |
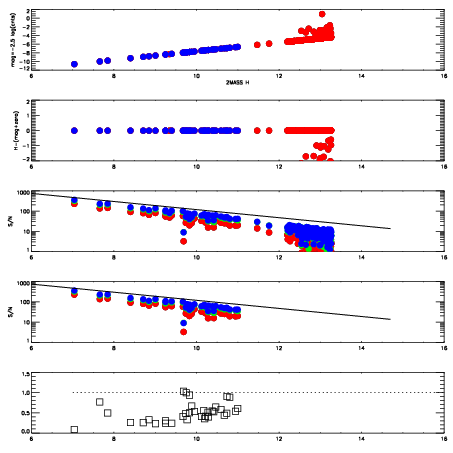

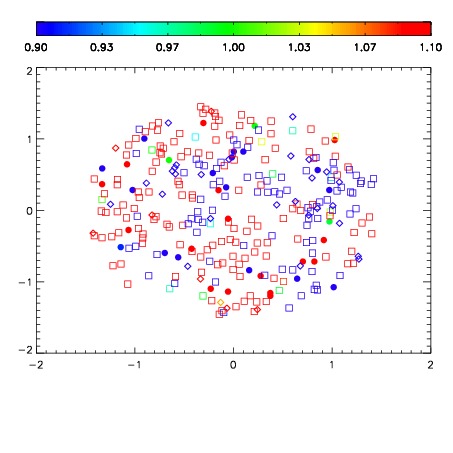
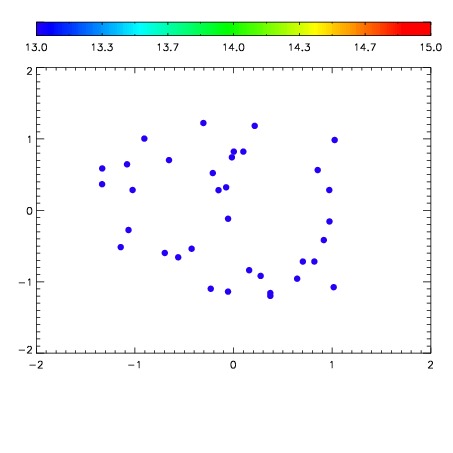

| Frame | Nreads | Zeropoints | Mag plots | Spatial mag deviation | Spatial sky 16325A emission deviations (filled: sky, open: star) | Spatial sky continuum emission | Spatial sky telluric CO2 absorption deviations (filled: H < 10) | |||||||||||||||||||||||
| 0 | 0 |
|
|
|
|
|
|
| IPAIR | NAME | SHIFT | NEWSHIFT | S/N | NAME | SHIFT | NEWSHIFT | S/N |
| 0 | 12260016 | 0.492822 | 0.00000 | 17.3256 | 12260011 | 0.00000 | 0.492822 | 17.3281 |
| 1 | 12260013 | 0.492660 | 0.000162005 | 17.3299 | 12260014 | 0.000206850 | 0.492615 | 17.3496 |
| 2 | 12260012 | 0.492162 | 0.000660002 | 17.2938 | 12260015 | 0.000667835 | 0.492154 | 17.3039 |
| 3 | 12260017 | 0.492765 | 5.69820e-05 | 17.2899 | 12260018 | 0.00201976 | 0.490802 | 17.2816 |