| Red | Green | Blue | |
| z | 17.64 | ||
| znorm | Inf | ||
| sky | -NaN | -NaN | -Inf |
| S/N | 30.8 | 51.7 | 55.2 |
| S/N(c) | 0.2 | 47.5 | 0.4 |
| SN(E/C) |
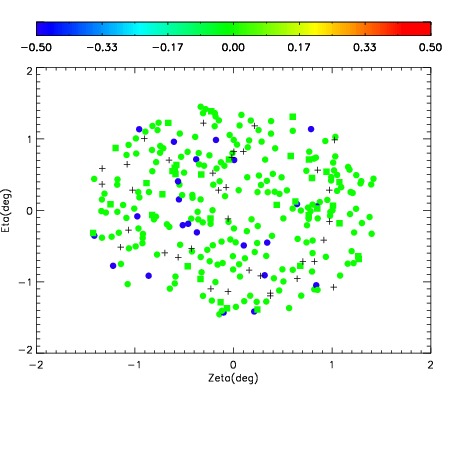
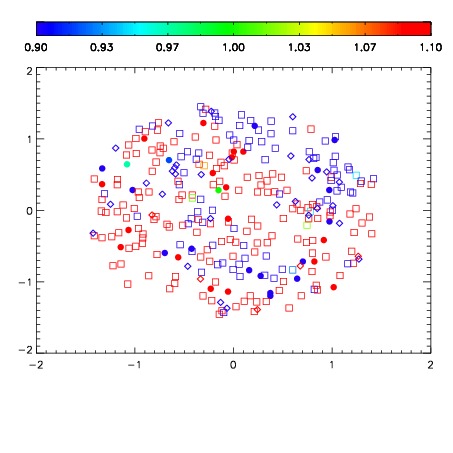
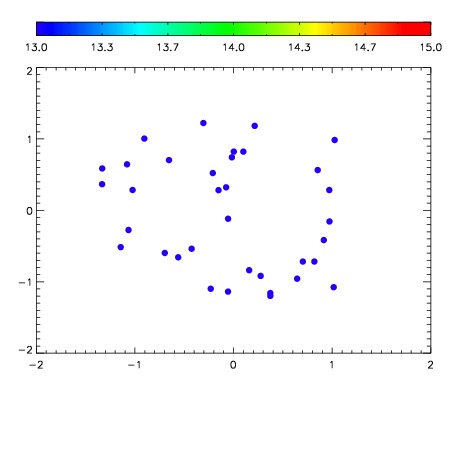

| Frame | Nreads | Zeropoints | Mag plots | Spatial mag deviation | Spatial sky 16325A emission deviations (filled: sky, open: star) | Spatial sky continuum emission | Spatial sky telluric CO2 absorption deviations (filled: H < 10) | |||||||||||||||||||||||
| 0 | 0 |
|
|
|
|
|
|
| IPAIR | NAME | SHIFT | NEWSHIFT | S/N | NAME | SHIFT | NEWSHIFT | S/N |
| 0 | 12310012 | 0.487563 | 0.00000 | 18.9813 | 12310011 | 0.00000 | 0.487563 | 18.8926 |
| 1 | 12310017 | 0.486830 | 0.000733018 | 19.1041 | 12310018 | -0.00834933 | 0.495912 | 19.1130 |
| 2 | 12310016 | 0.486273 | 0.00129002 | 19.0810 | 12310015 | -0.00221817 | 0.489781 | 19.0777 |
| 3 | 12310013 | 0.487363 | 0.000200003 | 18.9937 | 12310014 | -0.00261070 | 0.490174 | 19.0309 |