| Red | Green | Blue | |
| z | 17.64 | ||
| znorm | Inf | ||
| sky | -Inf | -Inf | -NaN |
| S/N | 23.0 | 40.4 | 42.5 |
| S/N(c) | 0.2 | 47.2 | 10.1 |
| SN(E/C) |

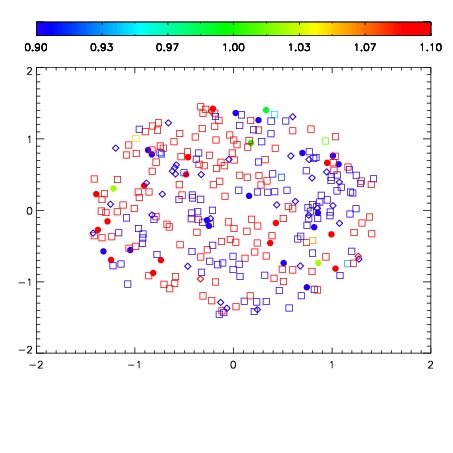


| Frame | Nreads | Zeropoints | Mag plots | Spatial mag deviation | Spatial sky 16325A emission deviations (filled: sky, open: star) | Spatial sky continuum emission | Spatial sky telluric CO2 absorption deviations (filled: H < 10) | |||||||||||||||||||||||
| 0 | 0 |
|
|
|
|
|
|
| IPAIR | NAME | SHIFT | NEWSHIFT | S/N | NAME | SHIFT | NEWSHIFT | S/N |
| 0 | 12250027 | 0.490958 | 0.00000 | 18.9522 | 12250022 | 0.00000 | 0.490958 | 18.8909 |
| 1 | 12250024 | 0.490008 | 0.000950009 | 18.9414 | 12250025 | -0.00108133 | 0.492039 | 18.8472 |
| 2 | 12250028 | 0.490761 | 0.000196993 | 18.9046 | 12250026 | -0.000757187 | 0.491715 | 18.7812 |
| 3 | 12250023 | 0.489032 | 0.00192600 | 18.8683 | 12250029 | 0.00250976 | 0.488448 | 18.7609 |