| Red | Green | Blue | |
| z | 17.64 | ||
| znorm | Inf | ||
| sky | -Inf | -Inf | -Inf |
| S/N | 11.9 | 22.8 | 22.9 |
| S/N(c) | 16.0 | 0.2 | 0.2 |
| SN(E/C) |
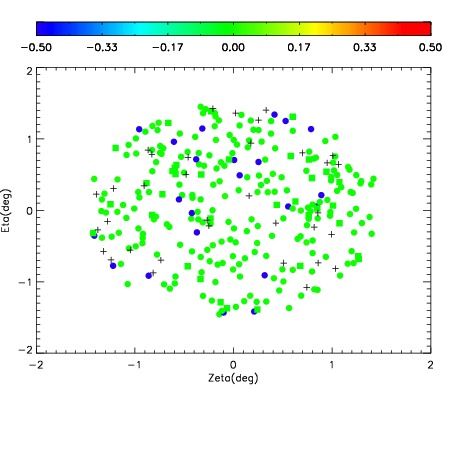
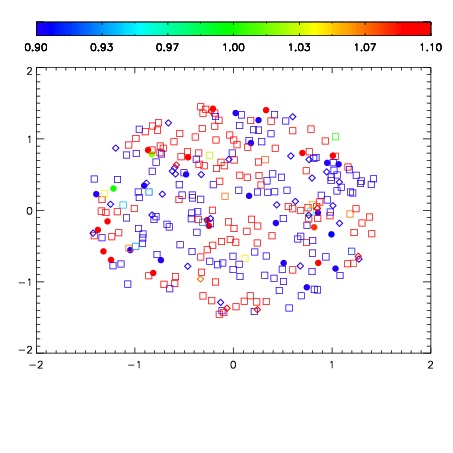
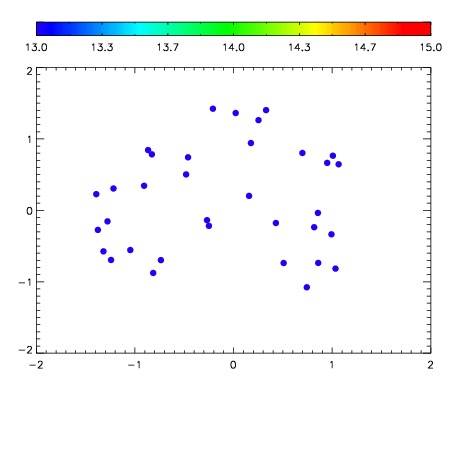

| Frame | Nreads | Zeropoints | Mag plots | Spatial mag deviation | Spatial sky 16325A emission deviations (filled: sky, open: star) | Spatial sky continuum emission | Spatial sky telluric CO2 absorption deviations (filled: H < 10) | |||||||||||||||||||||||
| 0 | 0 |
|
|
|
|
|
|
| IPAIR | NAME | SHIFT | NEWSHIFT | S/N | NAME | SHIFT | NEWSHIFT | S/N |
| 0 | 12290013 | 0.497028 | 0.00000 | 18.0510 | 12290011 | 0.00000 | 0.497028 | 17.9690 |
| 1 | 12290017 | 0.496217 | 0.000810981 | 17.7636 | 12290015 | -0.00155257 | 0.498581 | 17.8991 |
| 2 | 12290016 | 0.496613 | 0.000414997 | 17.7067 | 12290018 | -0.000680894 | 0.497709 | 17.8719 |
| 3 | 12290012 | 0.496558 | 0.000469983 | 17.5563 | 12290014 | -0.00143422 | 0.498462 | 17.6971 |