| Red | Green | Blue | |
| z | 17.64 | ||
| znorm | Inf | ||
| sky | -Inf | -Inf | -Inf |
| S/N | 25.8 | 43.9 | 46.5 |
| S/N(c) | 0.3 | 10.2 | 0.5 |
| SN(E/C) |


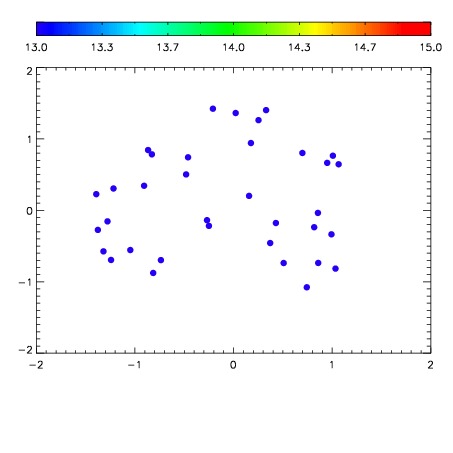

| Frame | Nreads | Zeropoints | Mag plots | Spatial mag deviation | Spatial sky 16325A emission deviations (filled: sky, open: star) | Spatial sky continuum emission | Spatial sky telluric CO2 absorption deviations (filled: H < 10) | |||||||||||||||||||||||
| 0 | 0 |
|
|
|
|
|
|
| IPAIR | NAME | SHIFT | NEWSHIFT | S/N | NAME | SHIFT | NEWSHIFT | S/N |
| 0 | 12540017 | 0.491626 | 0.00000 | 19.1212 | 12540015 | 0.000210972 | 0.491415 | 19.1160 |
| 1 | 12540013 | 0.490272 | 0.00135401 | 19.1301 | 12540018 | 0.000780216 | 0.490846 | 19.1549 |
| 2 | 12540012 | 0.490449 | 0.00117698 | 19.1278 | 12540011 | 0.00000 | 0.491626 | 19.1166 |
| 3 | 12540016 | 0.491158 | 0.000467986 | 19.1006 | 12540014 | -0.000104970 | 0.491731 | 19.0977 |