| Red | Green | Blue | |
| z | 17.64 | ||
| znorm | Inf | ||
| sky | -Inf | -Inf | -NaN |
| S/N | 25.6 | 44.1 | 45.9 |
| S/N(c) | 0.0 | 0.0 | 0.0 |
| SN(E/C) |


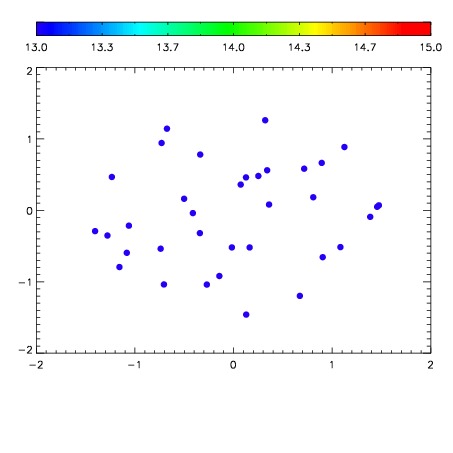

| Frame | Nreads | Zeropoints | Mag plots | Spatial mag deviation | Spatial sky 16325A emission deviations (filled: sky, open: star) | Spatial sky continuum emission | Spatial sky telluric CO2 absorption deviations (filled: H < 10) | |||||||||||||||||||||||
| 0 | 0 |
|
|
|
|
|
|
| IPAIR | NAME | SHIFT | NEWSHIFT | S/N | NAME | SHIFT | NEWSHIFT | S/N |
| 0 | 11940032 | 0.500388 | 0.00000 | 19.0890 | 11940033 | -0.00105520 | 0.501443 | 19.0692 |
| 1 | 11940028 | 0.499895 | 0.000493020 | 19.0707 | 11940030 | -0.00172265 | 0.502111 | 19.0597 |
| 2 | 11940027 | 0.499554 | 0.000834018 | 19.0436 | 11940029 | -0.00187196 | 0.502260 | 19.0559 |
| 3 | 11940031 | 0.500091 | 0.000297010 | 19.0209 | 11940026 | 0.00000 | 0.500388 | 19.0217 |