| Red | Green | Blue | |
| z | 17.64 | ||
| znorm | Inf | ||
| sky | -NaN | -NaN | -Inf |
| S/N | 21.2 | 37.9 | 40.4 |
| S/N(c) | 0.0 | 0.0 | 0.0 |
| SN(E/C) |
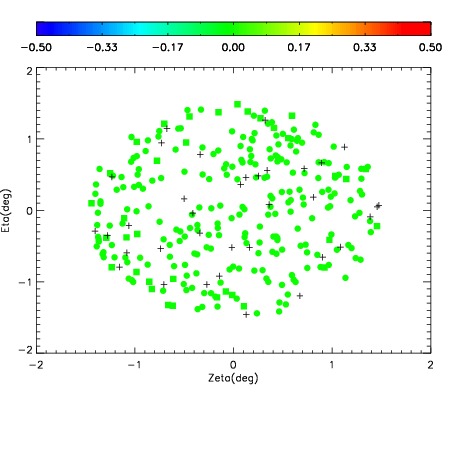
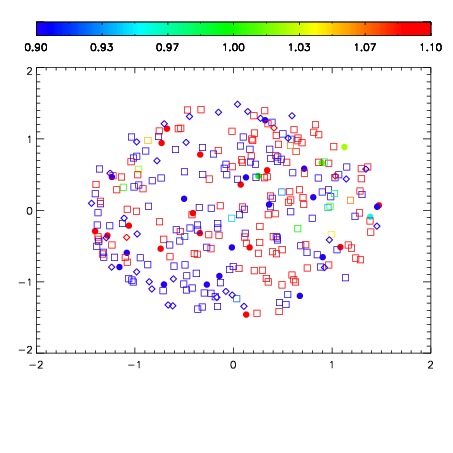
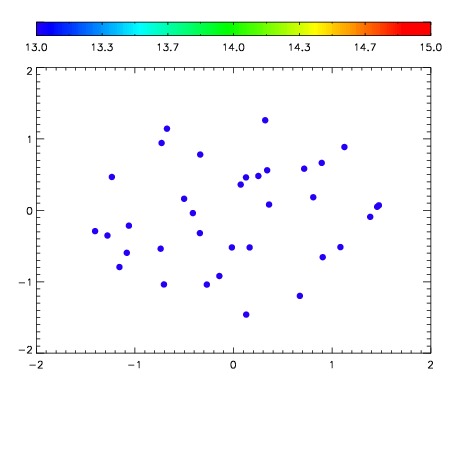

| Frame | Nreads | Zeropoints | Mag plots | Spatial mag deviation | Spatial sky 16325A emission deviations (filled: sky, open: star) | Spatial sky continuum emission | Spatial sky telluric CO2 absorption deviations (filled: H < 10) | |||||||||||||||||||||||
| 0 | 0 |
|
|
|
|
|
|
| IPAIR | NAME | SHIFT | NEWSHIFT | S/N | NAME | SHIFT | NEWSHIFT | S/N |
| 0 | 11990013 | 0.505023 | 0.00000 | 18.7756 | 11990015 | -0.00234275 | 0.507366 | 18.8109 |
| 1 | 11990017 | 0.503015 | 0.00200802 | 18.8482 | 11990018 | -0.00102812 | 0.506051 | 18.9050 |
| 2 | 11990016 | 0.502918 | 0.00210500 | 18.8290 | 11990014 | -0.00219575 | 0.507219 | 18.8271 |
| 3 | 11990012 | 0.504707 | 0.000316024 | 18.7714 | 11990011 | 0.00000 | 0.505023 | 18.7179 |