| Red | Green | Blue | |
| z | 17.63 | ||
| znorm | Inf | ||
| sky | -Inf | -NaN | -Inf |
| S/N | 25.9 | 46.8 | 51.4 |
| S/N(c) | 0.0 | 0.0 | 0.0 |
| SN(E/C) |
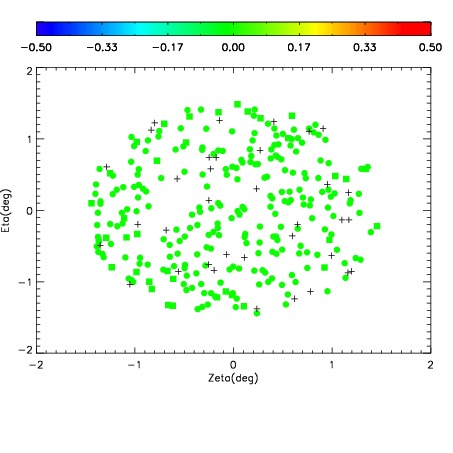
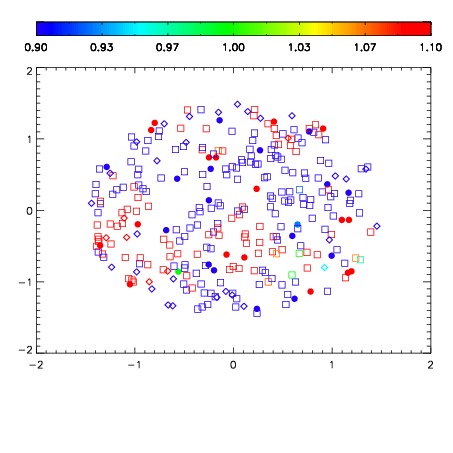
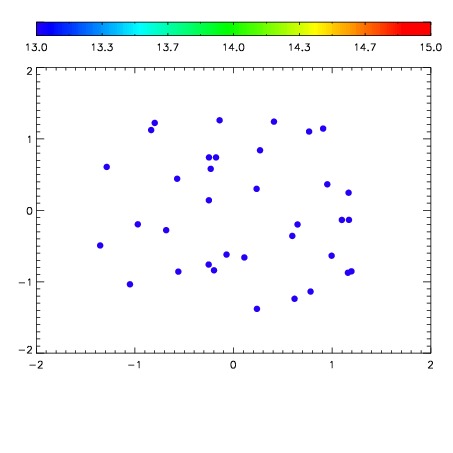

| Frame | Nreads | Zeropoints | Mag plots | Spatial mag deviation | Spatial sky 16325A emission deviations (filled: sky, open: star) | Spatial sky continuum emission | Spatial sky telluric CO2 absorption deviations (filled: H < 10) | |||||||||||||||||||||||
| 0 | 0 |
|
|
|
|
|
|
| IPAIR | NAME | SHIFT | NEWSHIFT | S/N | NAME | SHIFT | NEWSHIFT | S/N |
| 0 | 12530017 | 0.499600 | 0.00000 | 18.9742 | 12530018 | -0.00130762 | 0.500908 | 19.0115 |
| 1 | 12530013 | 0.495203 | 0.00439700 | 19.0862 | 12530014 | -0.000190642 | 0.499791 | 19.0690 |
| 2 | 12530012 | 0.495107 | 0.00449300 | 19.0799 | 12530011 | 0.00000 | 0.499600 | 19.0461 |
| 3 | 12530016 | 0.499598 | 1.99676e-06 | 18.9965 | 12530015 | -0.000199847 | 0.499800 | 19.0253 |