| Red | Green | Blue | |
| z | 17.64 | ||
| znorm | Inf | ||
| sky | -Inf | -Inf | -Inf |
| S/N | 18.7 | 32.9 | 36.0 |
| S/N(c) | 0.0 | 0.0 | 0.0 |
| SN(E/C) |
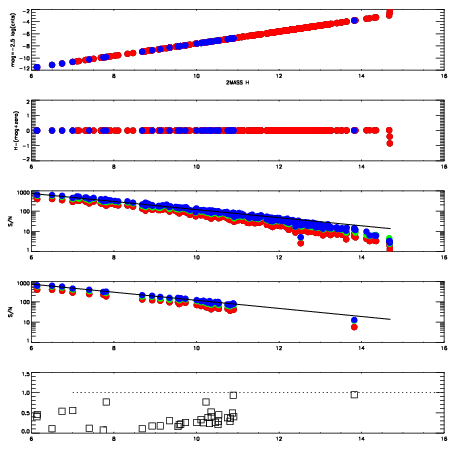
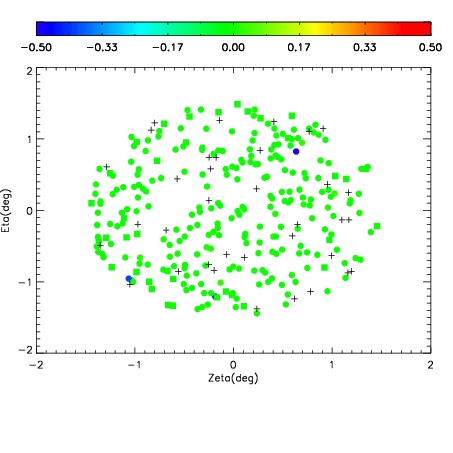
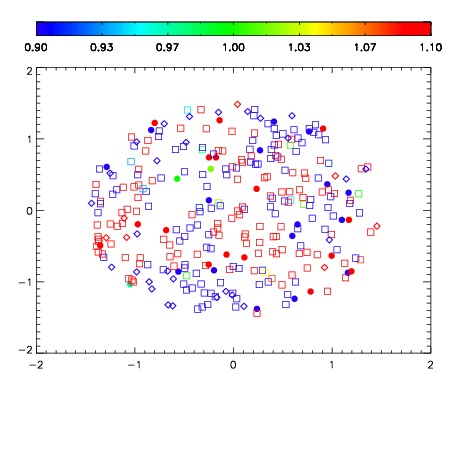
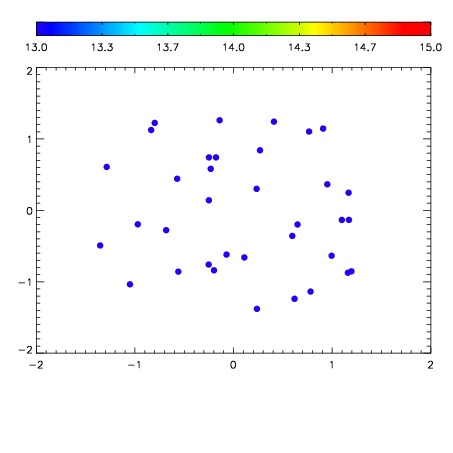

| Frame | Nreads | Zeropoints | Mag plots | Spatial mag deviation | Spatial sky 16325A emission deviations (filled: sky, open: star) | Spatial sky continuum emission | Spatial sky telluric CO2 absorption deviations (filled: H < 10) | |||||||||||||||||||||||
| 0 | 0 |
|
|
|
|
|
|
| IPAIR | NAME | SHIFT | NEWSHIFT | S/N | NAME | SHIFT | NEWSHIFT | S/N |
| 0 | 12570016 | 0.487002 | 0.00000 | 18.5724 | 12570014 | 0.000828462 | 0.486174 | 18.4541 |
| 1 | 12570012 | 0.484923 | 0.00207898 | 18.8333 | 12570011 | 0.00000 | 0.487002 | 18.8684 |
| 2 | 12570017 | 0.486957 | 4.49717e-05 | 18.6656 | 12570018 | 0.00262291 | 0.484379 | 18.7184 |
| 3 | 12570013 | 0.484922 | 0.00207999 | 18.4075 | 12570015 | 0.00143903 | 0.485563 | 17.9687 |