| Red | Green | Blue | |
| z | 17.64 | ||
| znorm | Inf | ||
| sky | -Inf | -Inf | -Inf |
| S/N | 25.7 | 45.1 | 47.8 |
| S/N(c) | 0.0 | 0.0 | 0.0 |
| SN(E/C) |
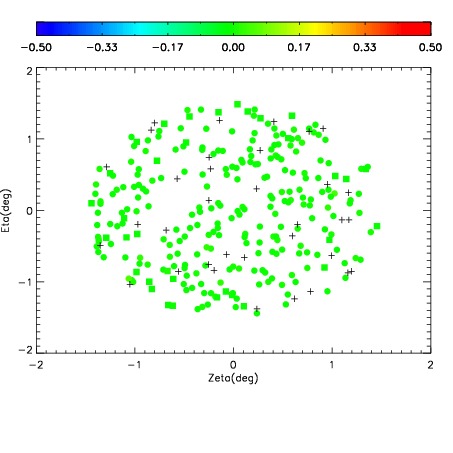
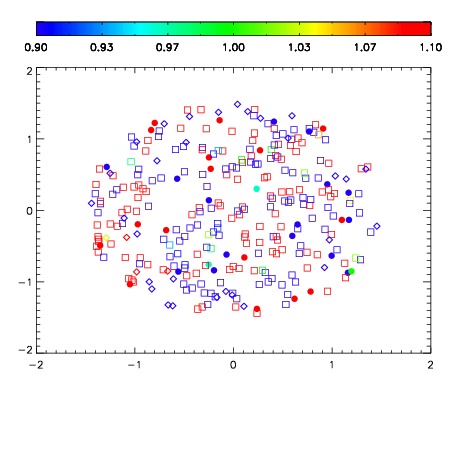
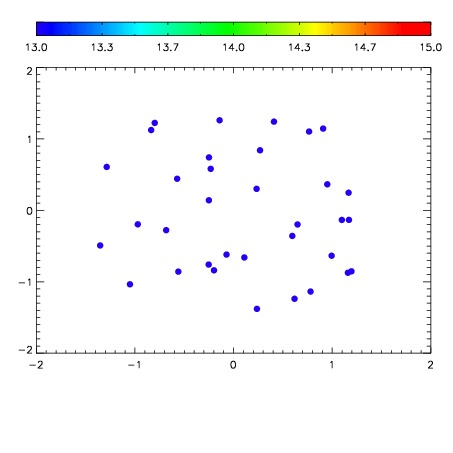

| Frame | Nreads | Zeropoints | Mag plots | Spatial mag deviation | Spatial sky 16325A emission deviations (filled: sky, open: star) | Spatial sky continuum emission | Spatial sky telluric CO2 absorption deviations (filled: H < 10) | |||||||||||||||||||||||
| 0 | 0 |
|
|
|
|
|
|
| IPAIR | NAME | SHIFT | NEWSHIFT | S/N | NAME | SHIFT | NEWSHIFT | S/N |
| 0 | 12620017 | 0.487560 | 0.00000 | 18.9257 | 12620018 | 0.000790524 | 0.486769 | 18.6784 |
| 1 | 12620012 | 0.486278 | 0.00128201 | 19.0661 | 12620011 | 0.00000 | 0.487560 | 19.0477 |
| 2 | 12620013 | 0.486317 | 0.00124300 | 19.0622 | 12620014 | 0.000486037 | 0.487074 | 19.0412 |
| 3 | 12620016 | 0.487248 | 0.000312001 | 18.9318 | 12620015 | 0.000919852 | 0.486640 | 19.0257 |