| Red | Green | Blue | |
| z | 17.64 | ||
| znorm | Inf | ||
| sky | -Inf | -Inf | -Inf |
| S/N | 19.5 | 36.2 | 40.4 |
| S/N(c) | 0.0 | 0.0 | 0.0 |
| SN(E/C) |
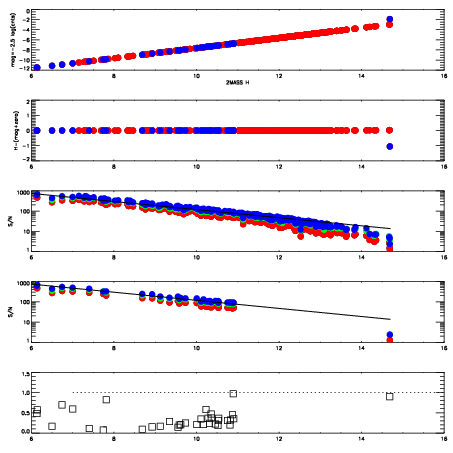
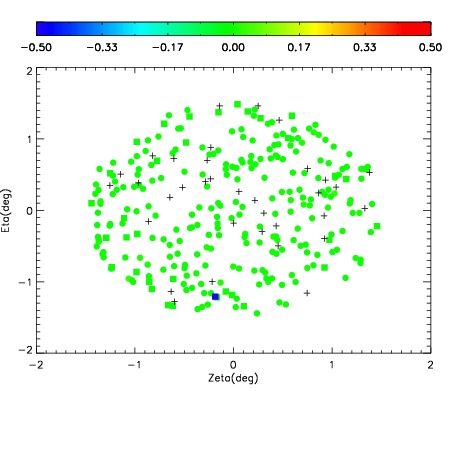
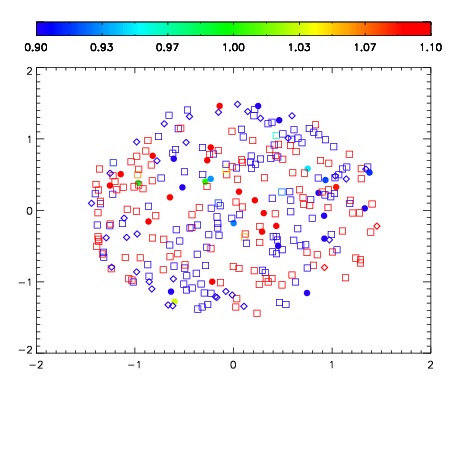
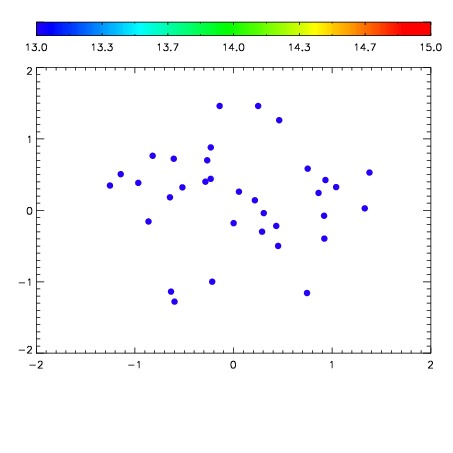

| Frame | Nreads | Zeropoints | Mag plots | Spatial mag deviation | Spatial sky 16325A emission deviations (filled: sky, open: star) | Spatial sky continuum emission | Spatial sky telluric CO2 absorption deviations (filled: H < 10) | |||||||||||||||||||||||
| 0 | 0 |
|
|
|
|
|
|
| IPAIR | NAME | SHIFT | NEWSHIFT | S/N | NAME | SHIFT | NEWSHIFT | S/N |
| 0 | 12280017 | 0.497640 | 0.00000 | 18.7796 | 12280014 | -0.00144281 | 0.499083 | 18.8149 |
| 1 | 12280013 | 0.497275 | 0.000365019 | 18.7720 | 12280015 | -0.000793801 | 0.498434 | 18.7701 |
| 2 | 12280012 | 0.497094 | 0.000546008 | 18.7472 | 12280018 | -0.00117876 | 0.498819 | 18.7442 |
| 3 | 12280016 | 0.497410 | 0.000230014 | 18.6772 | 12280011 | 0.00000 | 0.497640 | 18.6941 |