| Red | Green | Blue | |
| z | 17.64 | ||
| znorm | Inf | ||
| sky | -Inf | -NaN | -Inf |
| S/N | 27.6 | 48.8 | 54.0 |
| S/N(c) | 0.0 | 0.0 | 0.0 |
| SN(E/C) |
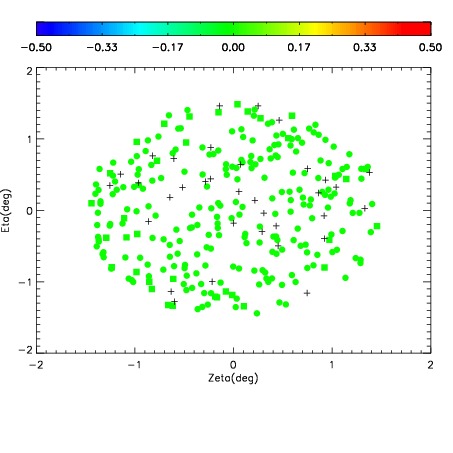
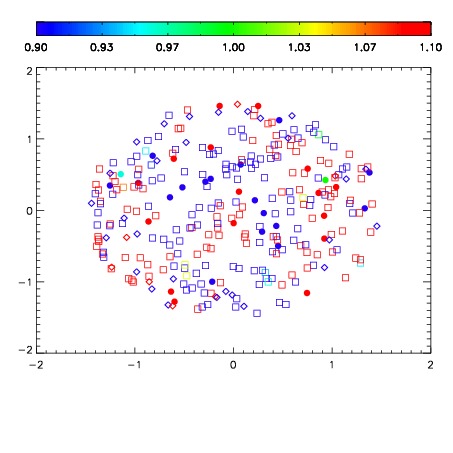


| Frame | Nreads | Zeropoints | Mag plots | Spatial mag deviation | Spatial sky 16325A emission deviations (filled: sky, open: star) | Spatial sky continuum emission | Spatial sky telluric CO2 absorption deviations (filled: H < 10) | |||||||||||||||||||||||
| 0 | 0 |
|
|
|
|
|
|
| IPAIR | NAME | SHIFT | NEWSHIFT | S/N | NAME | SHIFT | NEWSHIFT | S/N |
| 0 | 12520017 | 0.491137 | 0.00000 | 19.0676 | 12520011 | 0.00000 | 0.491137 | 19.0757 |
| 1 | 12520013 | 0.490782 | 0.000355005 | 19.1325 | 12520015 | 0.00111674 | 0.490020 | 19.1260 |
| 2 | 12520012 | 0.490897 | 0.000239998 | 19.1051 | 12520014 | 0.000858434 | 0.490279 | 19.1018 |
| 3 | 12520016 | 0.490626 | 0.000510991 | 19.0871 | 12520018 | 0.00231347 | 0.488824 | 19.0847 |