| Red | Green | Blue | |
| z | 17.64 | ||
| znorm | Inf | ||
| sky | -Inf | -NaN | -Inf |
| S/N | 27.9 | 49.0 | 53.3 |
| S/N(c) | 0.0 | 0.0 | 0.0 |
| SN(E/C) |
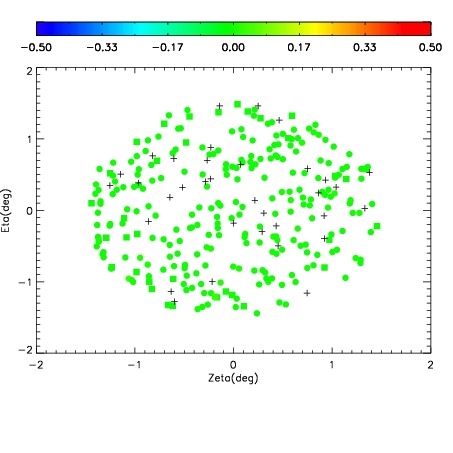
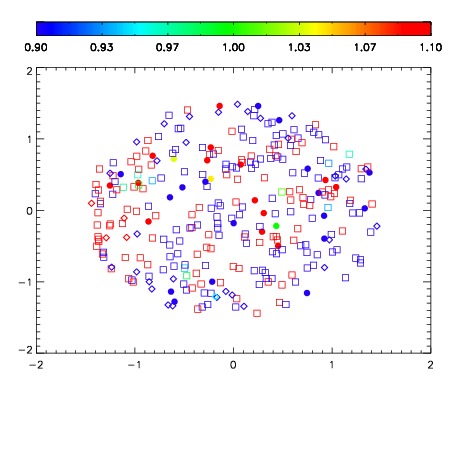


| Frame | Nreads | Zeropoints | Mag plots | Spatial mag deviation | Spatial sky 16325A emission deviations (filled: sky, open: star) | Spatial sky continuum emission | Spatial sky telluric CO2 absorption deviations (filled: H < 10) | |||||||||||||||||||||||
| 0 | 0 |
|
|
|
|
|
|
| IPAIR | NAME | SHIFT | NEWSHIFT | S/N | NAME | SHIFT | NEWSHIFT | S/N |
| 0 | 12560013 | 0.493841 | 0.00000 | 19.1723 | 12560018 | 0.00103785 | 0.492803 | 19.1796 |
| 1 | 12560017 | 0.493367 | 0.000474006 | 19.2137 | 12560015 | -0.00108698 | 0.494928 | 19.1989 |
| 2 | 12560016 | 0.493634 | 0.000207007 | 19.1990 | 12560014 | -0.00116254 | 0.495004 | 19.1870 |
| 3 | 12560012 | 0.493557 | 0.000283986 | 19.1632 | 12560011 | 0.00000 | 0.493841 | 19.1720 |