| Red | Green | Blue | |
| z | 17.64 | ||
| znorm | Inf | ||
| sky | -NaN | -Inf | -Inf |
| S/N | 26.3 | 41.7 | 48.8 |
| S/N(c) | 0.0 | 0.0 | 0.0 |
| SN(E/C) |
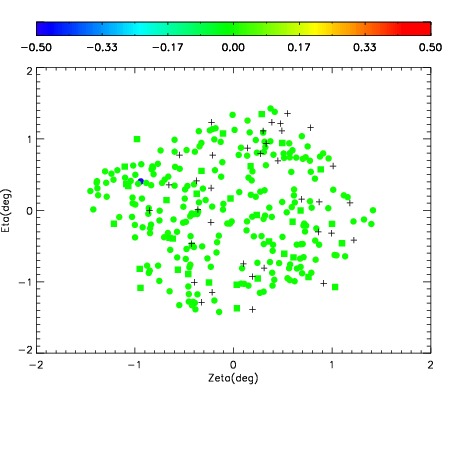
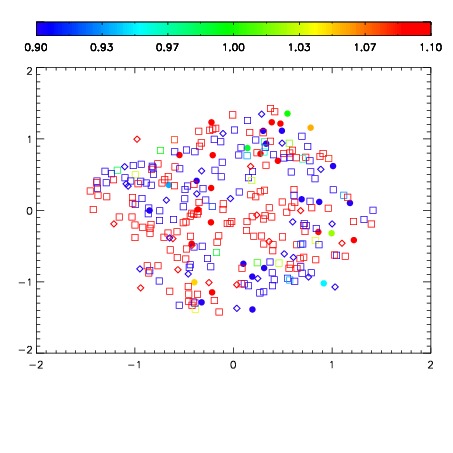
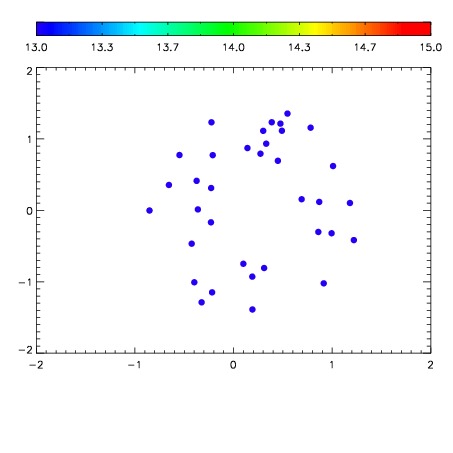

| Frame | Nreads | Zeropoints | Mag plots | Spatial mag deviation | Spatial sky 16325A emission deviations (filled: sky, open: star) | Spatial sky continuum emission | Spatial sky telluric CO2 absorption deviations (filled: H < 10) | |||||||||||||||||||||||
| 0 | 0 |
|
|
|
|
|
|
| IPAIR | NAME | SHIFT | NEWSHIFT | S/N | NAME | SHIFT | NEWSHIFT | S/N |
| 0 | 11950075 | 0.500037 | 0.00000 | 19.1399 | 11950073 | -0.00295240 | 0.502989 | 19.1010 |
| 1 | 11950074 | 0.499738 | 0.000299007 | 19.1432 | 11950076 | -0.00332341 | 0.503360 | 19.1193 |
| 2 | 11950071 | 0.499782 | 0.000255018 | 19.0283 | 11950072 | -0.00314807 | 0.503185 | 19.0756 |
| 3 | 11950070 | 0.500021 | 1.60336e-05 | 19.0033 | 11950069 | 0.00000 | 0.500037 | 18.9564 |