| Red | Green | Blue | |
| z | 17.64 | ||
| znorm | Inf | ||
| sky | -NaN | -Inf | -NaN |
| S/N | 21.8 | 35.3 | 35.7 |
| S/N(c) | 0.0 | 0.0 | 0.0 |
| SN(E/C) |
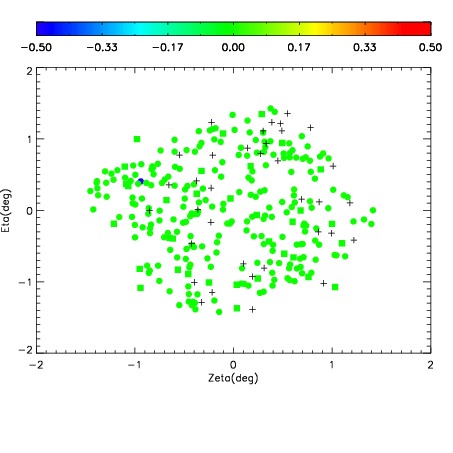
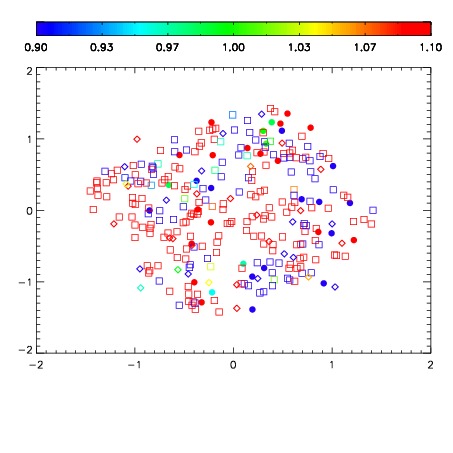
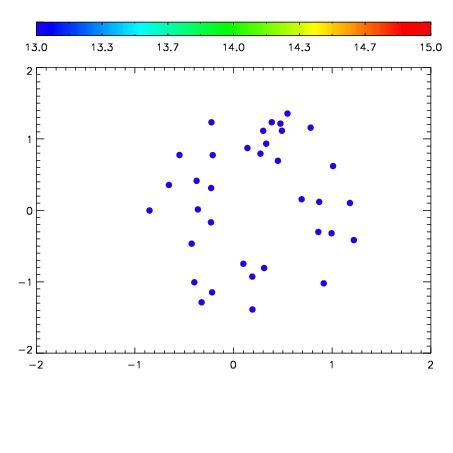

| Frame | Nreads | Zeropoints | Mag plots | Spatial mag deviation | Spatial sky 16325A emission deviations (filled: sky, open: star) | Spatial sky continuum emission | Spatial sky telluric CO2 absorption deviations (filled: H < 10) | |||||||||||||||||||||||
| 0 | 0 |
|
|
|
|
|
|
| IPAIR | NAME | SHIFT | NEWSHIFT | S/N | NAME | SHIFT | NEWSHIFT | S/N |
| 0 | 11980024 | 0.503927 | 0.00000 | 18.7963 | 11980029 | -0.00461832 | 0.508545 | 18.8321 |
| 1 | 11980027 | 0.499831 | 0.00409600 | 18.9107 | 11980026 | -0.00399303 | 0.507920 | 18.8702 |
| 2 | 11980023 | 0.503619 | 0.000307977 | 18.8326 | 11980025 | -0.00503623 | 0.508963 | 18.8346 |
| 3 | 11980028 | 0.499570 | 0.00435698 | 18.6982 | 11980022 | 0.00000 | 0.503927 | 18.7771 |