| Red | Green | Blue | |
| z | 17.64 | ||
| znorm | Inf | ||
| sky | -Inf | -Inf | -Inf |
| S/N | 5.3 | 11.0 | 11.4 |
| S/N(c) | 0.0 | 0.0 | 0.0 |
| SN(E/C) |
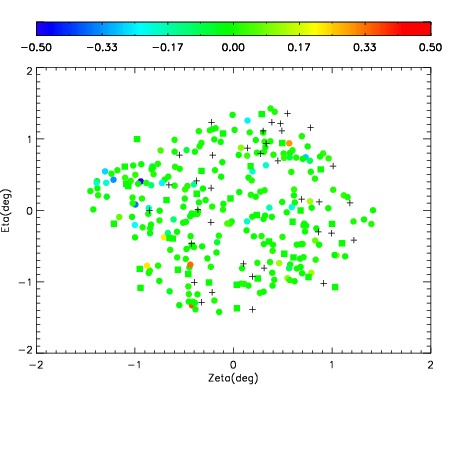
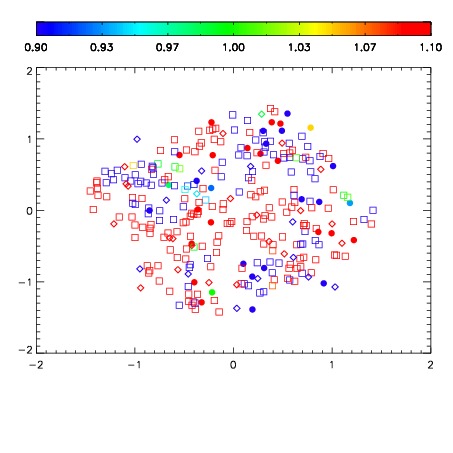
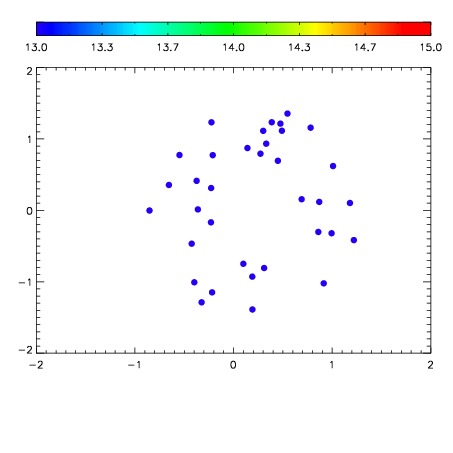

| Frame | Nreads | Zeropoints | Mag plots | Spatial mag deviation | Spatial sky 16325A emission deviations (filled: sky, open: star) | Spatial sky continuum emission | Spatial sky telluric CO2 absorption deviations (filled: H < 10) | |||||||||||||||||||||||
| 0 | 0 |
|
|
|
|
|
|
| IPAIR | NAME | SHIFT | NEWSHIFT | S/N | NAME | SHIFT | NEWSHIFT | S/N |
| 0 | 11990047 | 0.502831 | 0.00000 | 17.6787 | 11990046 | 0.00000 | 0.502831 | 17.8940 |
| 1 | 11990048 | 0.500702 | 0.00212896 | 16.6876 | 11990049 | -0.00413767 | 0.506969 | 16.8553 |
| 2 | 11990052 | 0.497107 | 0.00572398 | 15.9538 | 11990050 | -0.00511894 | 0.507950 | 16.7781 |
| 3 | 11990051 | 0.497470 | 0.00536099 | 15.9364 | 11990053 | -0.00844583 | 0.511277 | 15.2802 |