| Red | Green | Blue | |
| z | 17.64 | ||
| znorm | Inf | ||
| sky | -Inf | -NaN | -Inf |
| S/N | 22.0 | 37.1 | 44.5 |
| S/N(c) | 0.0 | 0.0 | 0.0 |
| SN(E/C) |
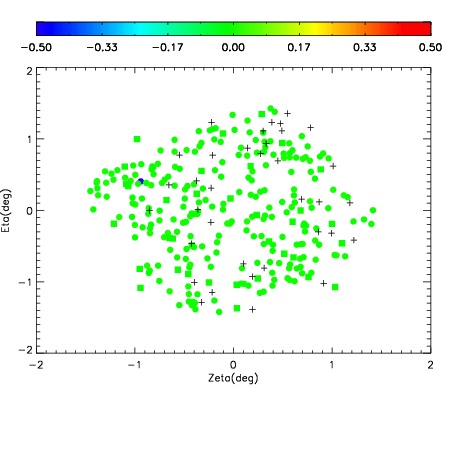
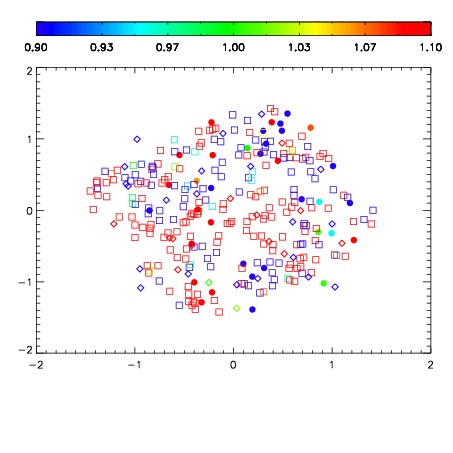
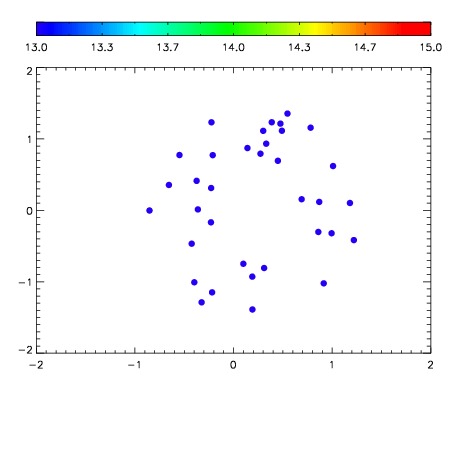

| Frame | Nreads | Zeropoints | Mag plots | Spatial mag deviation | Spatial sky 16325A emission deviations (filled: sky, open: star) | Spatial sky continuum emission | Spatial sky telluric CO2 absorption deviations (filled: H < 10) | |||||||||||||||||||||||
| 0 | 0 |
|
|
|
|
|
|
| IPAIR | NAME | SHIFT | NEWSHIFT | S/N | NAME | SHIFT | NEWSHIFT | S/N |
| 0 | 12000061 | 0.501308 | 0.00000 | 18.9516 | 12000062 | -0.00402372 | 0.505332 | 18.9897 |
| 1 | 12000060 | 0.500669 | 0.000639021 | 19.0552 | 12000059 | -0.00406463 | 0.505373 | 19.0368 |
| 2 | 12000056 | 0.500434 | 0.000874043 | 18.9433 | 12000055 | 0.00000 | 0.501308 | 18.9686 |
| 3 | 12000057 | 0.500927 | 0.000381052 | 18.9158 | 12000058 | -0.00373982 | 0.505048 | 18.8945 |