| Red | Green | Blue | |
| z | 17.64 | ||
| znorm | Inf | ||
| sky | -Inf | -Inf | -NaN |
| S/N | 21.0 | 34.7 | 35.5 |
| S/N(c) | 0.0 | 0.0 | 0.0 |
| SN(E/C) |
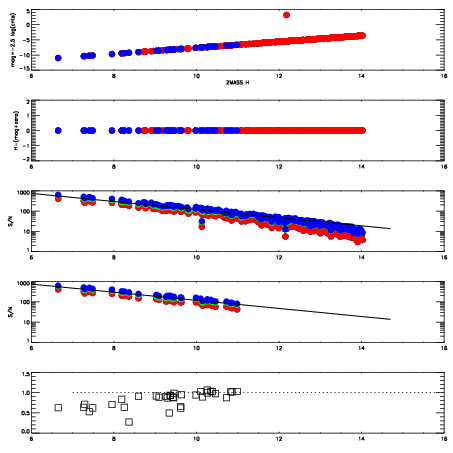
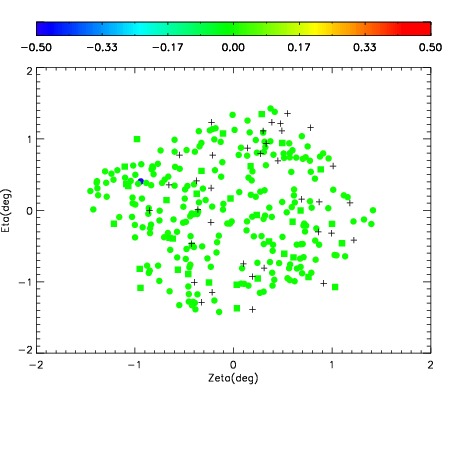
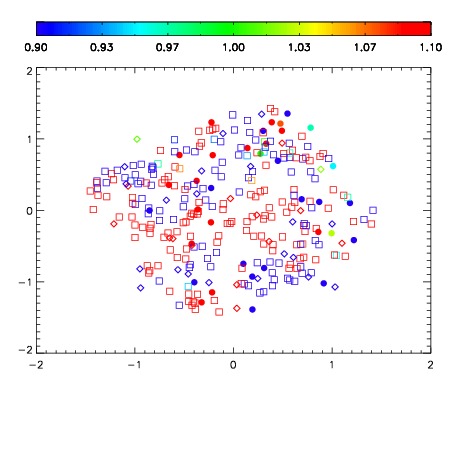
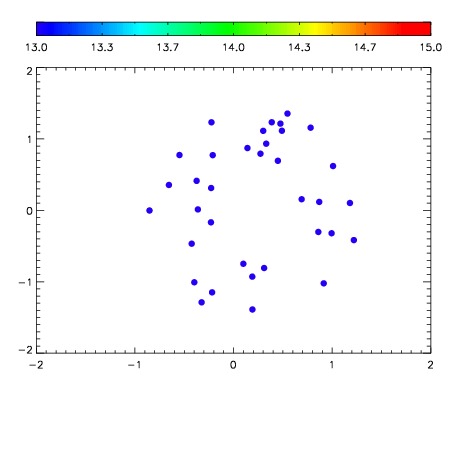

| Frame | Nreads | Zeropoints | Mag plots | Spatial mag deviation | Spatial sky 16325A emission deviations (filled: sky, open: star) | Spatial sky continuum emission | Spatial sky telluric CO2 absorption deviations (filled: H < 10) | |||||||||||||||||||||||
| 0 | 0 |
|
|
|
|
|
|
| IPAIR | NAME | SHIFT | NEWSHIFT | S/N | NAME | SHIFT | NEWSHIFT | S/N |
| 0 | 12010030 | 0.506149 | 0.00000 | 18.5636 | 12010032 | -0.00237750 | 0.508527 | 18.6615 |
| 1 | 12010035 | 0.504535 | 0.00161397 | 18.9788 | 12010036 | -0.00262787 | 0.508777 | 19.0324 |
| 2 | 12010034 | 0.504756 | 0.00139302 | 18.8941 | 12010033 | -0.00190573 | 0.508055 | 18.8286 |
| 3 | 12010031 | 0.505810 | 0.000338972 | 18.3617 | 12010029 | 0.00000 | 0.506149 | 18.4374 |