| Red | Green | Blue | |
| z | 17.64 | ||
| znorm | Inf | ||
| sky | -Inf | -Inf | -Inf |
| S/N | 17.3 | 31.0 | 34.5 |
| S/N(c) | 0.0 | 0.0 | 0.0 |
| SN(E/C) |
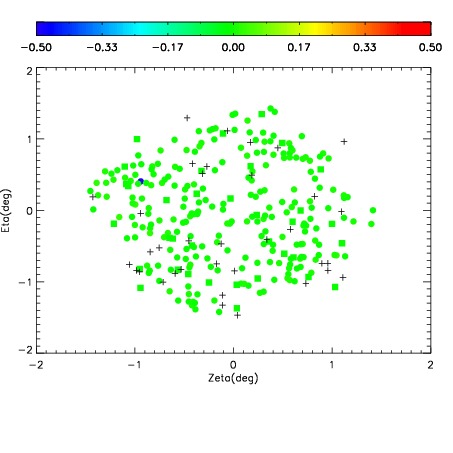
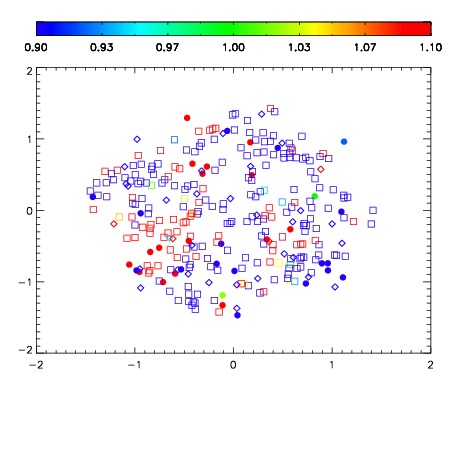
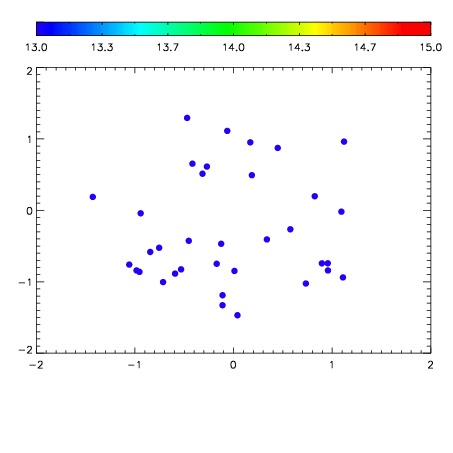

| Frame | Nreads | Zeropoints | Mag plots | Spatial mag deviation | Spatial sky 16325A emission deviations (filled: sky, open: star) | Spatial sky continuum emission | Spatial sky telluric CO2 absorption deviations (filled: H < 10) | |||||||||||||||||||||||
| 0 | 0 |
|
|
|
|
|
|
| IPAIR | NAME | SHIFT | NEWSHIFT | S/N | NAME | SHIFT | NEWSHIFT | S/N |
| 0 | 12220012 | 0.498830 | 0.00000 | 18.9511 | 12220014 | -0.00299176 | 0.501822 | 18.8826 |
| 1 | 12220013 | 0.498177 | 0.000652999 | 19.0005 | 12220011 | 0.00000 | 0.498830 | 18.8932 |
| 2 | 12220017 | 0.495927 | 0.00290298 | 15.2102 | 12220015 | -0.00290568 | 0.501736 | 17.7876 |
| 3 | 12220016 | 0.495026 | 0.00380400 | 13.7666 | 12220018 | -0.00259414 | 0.501424 | 16.4764 |