| Red | Green | Blue | |
| z | 17.64 | ||
| znorm | Inf | ||
| sky | -Inf | -Inf | -NaN |
| S/N | 23.8 | 40.4 | 43.3 |
| S/N(c) | 0.0 | 0.0 | 0.0 |
| SN(E/C) |
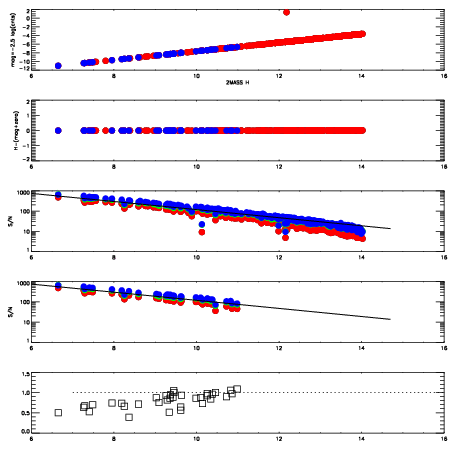
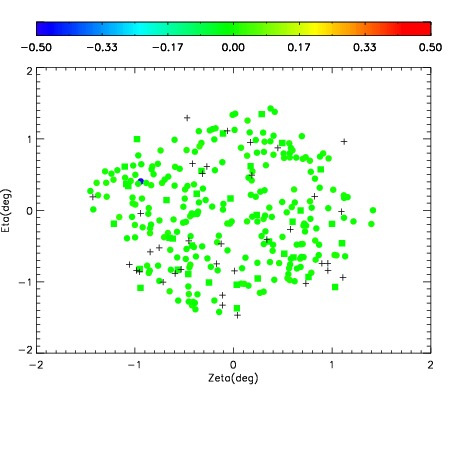
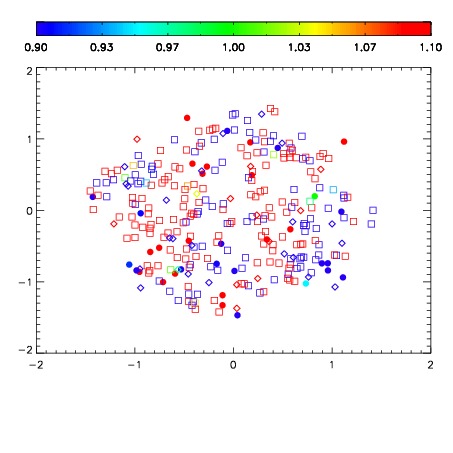
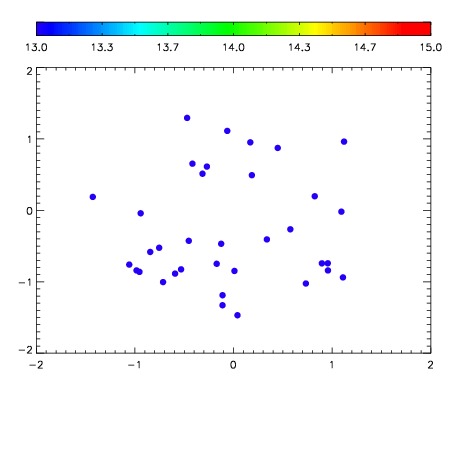

| Frame | Nreads | Zeropoints | Mag plots | Spatial mag deviation | Spatial sky 16325A emission deviations (filled: sky, open: star) | Spatial sky continuum emission | Spatial sky telluric CO2 absorption deviations (filled: H < 10) | |||||||||||||||||||||||
| 0 | 0 |
|
|
|
|
|
|
| IPAIR | NAME | SHIFT | NEWSHIFT | S/N | NAME | SHIFT | NEWSHIFT | S/N |
| 0 | 12230028 | 0.498872 | 0.00000 | 18.9034 | 12230033 | 0.000138164 | 0.498734 | 19.0069 |
| 1 | 12230031 | 0.497435 | 0.00143701 | 19.0182 | 12230029 | -0.00132932 | 0.500201 | 19.0284 |
| 2 | 12230032 | 0.497379 | 0.00149301 | 18.9405 | 12230030 | -0.00222523 | 0.501097 | 19.0134 |
| 3 | 12230027 | 0.498750 | 0.000122011 | 18.9028 | 12230026 | 0.00000 | 0.498872 | 18.8631 |