| Red | Green | Blue | |
| z | 17.64 | ||
| znorm | Inf | ||
| sky | -NaN | -Inf | -Inf |
| S/N | 23.0 | 41.2 | 47.7 |
| S/N(c) | 0.0 | 0.0 | 0.0 |
| SN(E/C) |
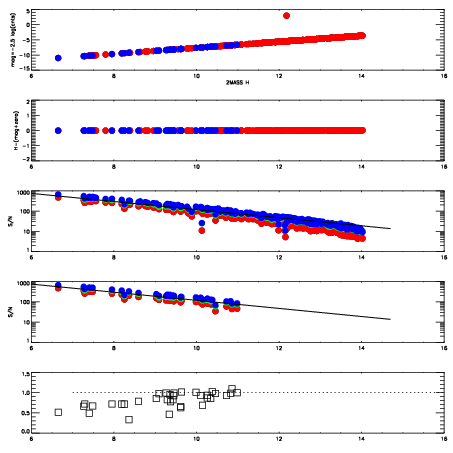
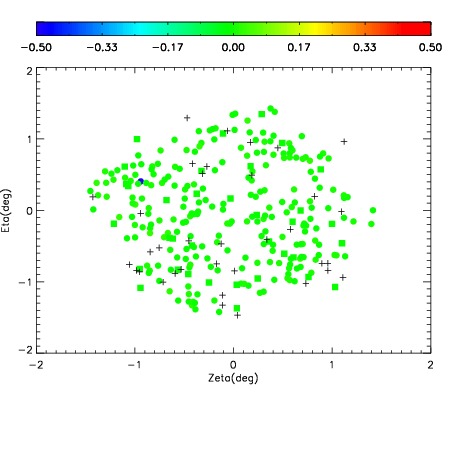
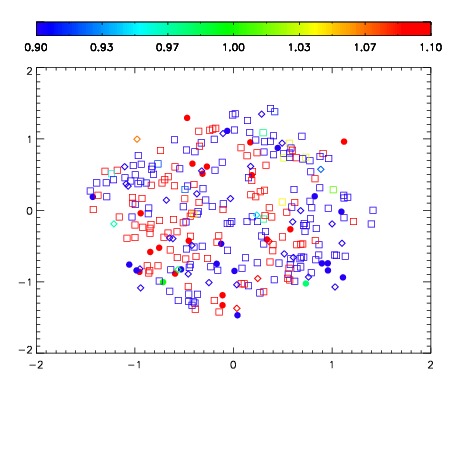
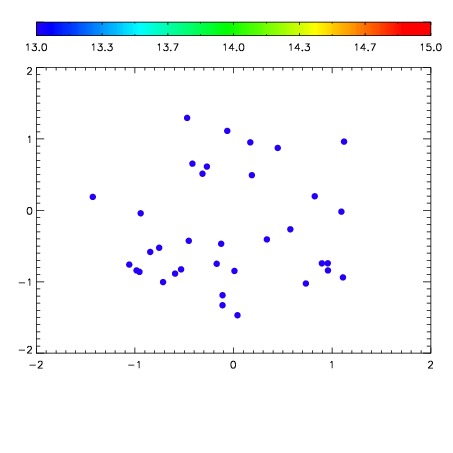

| Frame | Nreads | Zeropoints | Mag plots | Spatial mag deviation | Spatial sky 16325A emission deviations (filled: sky, open: star) | Spatial sky continuum emission | Spatial sky telluric CO2 absorption deviations (filled: H < 10) | |||||||||||||||||||||||
| 0 | 0 |
|
|
|
|
|
|
| IPAIR | NAME | SHIFT | NEWSHIFT | S/N | NAME | SHIFT | NEWSHIFT | S/N |
| 0 | 12250054 | 0.494205 | 0.00000 | 18.9975 | 12250055 | -4.46974e-05 | 0.494250 | 19.0090 |
| 1 | 12250053 | 0.493979 | 0.000225991 | 18.9908 | 12250052 | 0.00146554 | 0.492739 | 18.9745 |
| 2 | 12250050 | 0.493620 | 0.000584990 | 18.9009 | 12250051 | 0.00213693 | 0.492068 | 18.8521 |
| 3 | 12250049 | 0.493925 | 0.000279993 | 18.7960 | 12250048 | 0.00000 | 0.494205 | 18.7460 |