| Red | Green | Blue | |
| z | 17.64 | ||
| znorm | Inf | ||
| sky | -Inf | -NaN | -Inf |
| S/N | 18.2 | 34.6 | 38.2 |
| S/N(c) | 0.0 | 0.0 | 0.0 |
| SN(E/C) |
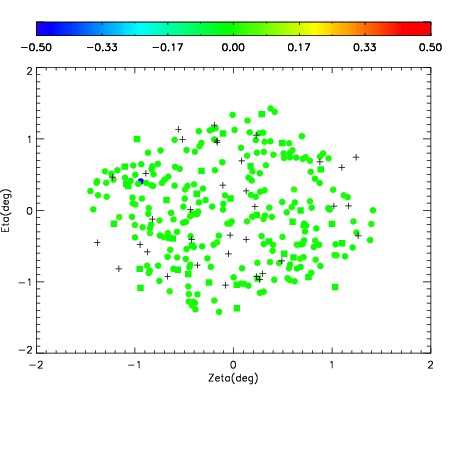


| Frame | Nreads | Zeropoints | Mag plots | Spatial mag deviation | Spatial sky 16325A emission deviations (filled: sky, open: star) | Spatial sky continuum emission | Spatial sky telluric CO2 absorption deviations (filled: H < 10) | |||||||||||||||||||||||
| 0 | 0 |
|
|
|
|
|
|
| IPAIR | NAME | SHIFT | NEWSHIFT | S/N | NAME | SHIFT | NEWSHIFT | S/N |
| 0 | 12500021 | 0.496152 | 0.00000 | 18.6610 | 12500019 | -0.00346411 | 0.499616 | 18.5480 |
| 1 | 12500020 | 0.494669 | 0.00148302 | 18.6791 | 12500022 | -0.00196098 | 0.498113 | 18.7150 |
| 2 | 12500017 | 0.493892 | 0.00226000 | 18.3938 | 12500018 | -0.00410846 | 0.500260 | 18.2770 |
| 3 | 12500016 | 0.494135 | 0.00201702 | 18.1566 | 12500015 | -0.00373138 | 0.499883 | 18.0721 |
| 4 | 12500012 | 0.492846 | 0.00330600 | 17.8149 | 12500014 | -0.00379581 | 0.499948 | 18.0669 |
| 5 | 12500013 | 0.494089 | 0.00206301 | 17.4441 | 12500011 | 0.00000 | 0.496152 | 17.9227 |