| Red | Green | Blue | |
| z | 17.64 | ||
| znorm | Inf | ||
| sky | -Inf | -Inf | -Inf |
| S/N | 20.5 | 34.8 | 41.8 |
| S/N(c) | 0.0 | 0.0 | 0.0 |
| SN(E/C) |


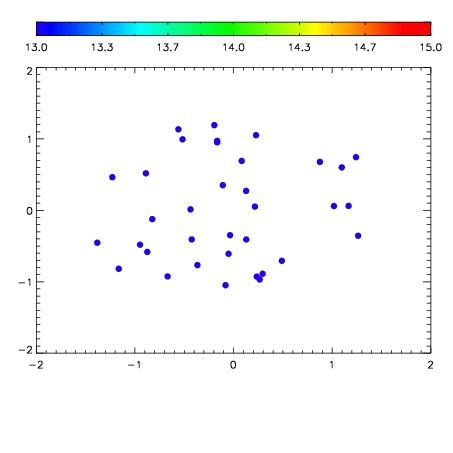

| Frame | Nreads | Zeropoints | Mag plots | Spatial mag deviation | Spatial sky 16325A emission deviations (filled: sky, open: star) | Spatial sky continuum emission | Spatial sky telluric CO2 absorption deviations (filled: H < 10) | |||||||||||||||||||||||
| 0 | 0 |
|
|
|
|
|
|
| IPAIR | NAME | SHIFT | NEWSHIFT | S/N | NAME | SHIFT | NEWSHIFT | S/N |
| 0 | 12520035 | 0.490874 | 0.00000 | 18.5060 | 12520036 | -0.00205934 | 0.492933 | 18.4980 |
| 1 | 12520038 | 0.489475 | 0.00139898 | 18.8970 | 12520040 | -0.00257005 | 0.493444 | 18.8930 |
| 2 | 12520039 | 0.489945 | 0.000928998 | 18.8859 | 12520037 | -0.00259838 | 0.493472 | 18.7453 |
| 3 | 12520034 | 0.490728 | 0.000146002 | 18.4725 | 12520033 | 0.00000 | 0.490874 | 18.3294 |