| Red | Green | Blue | |
| z | 17.64 | ||
| znorm | Inf | ||
| sky | -Inf | -NaN | -Inf |
| S/N | 25.5 | 43.5 | 49.0 |
| S/N(c) | 0.0 | 0.0 | 0.0 |
| SN(E/C) |
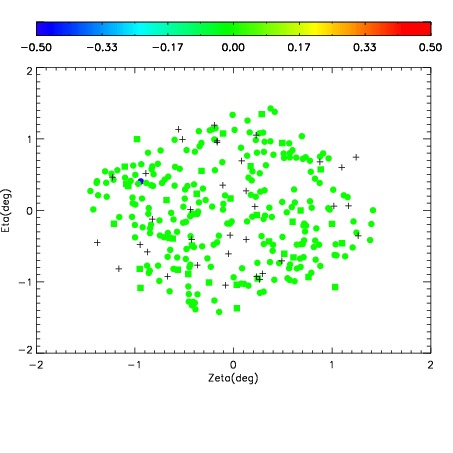

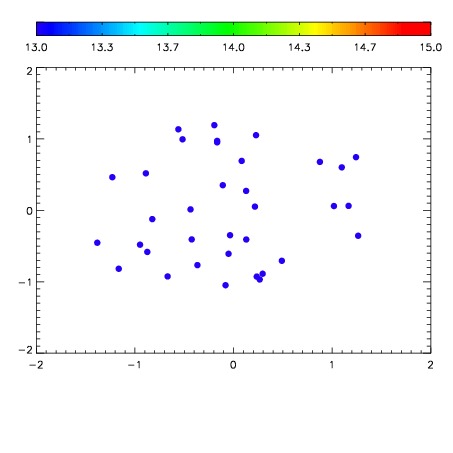

| Frame | Nreads | Zeropoints | Mag plots | Spatial mag deviation | Spatial sky 16325A emission deviations (filled: sky, open: star) | Spatial sky continuum emission | Spatial sky telluric CO2 absorption deviations (filled: H < 10) | |||||||||||||||||||||||
| 0 | 0 |
|
|
|
|
|
|
| IPAIR | NAME | SHIFT | NEWSHIFT | S/N | NAME | SHIFT | NEWSHIFT | S/N |
| 0 | 12530039 | 0.491809 | 0.00000 | 19.0842 | 12530041 | -0.00159338 | 0.493402 | 19.0520 |
| 1 | 12530043 | 0.490567 | 0.00124201 | 19.0874 | 12530040 | -0.00194229 | 0.493751 | 19.0768 |
| 2 | 12530042 | 0.490094 | 0.00171500 | 19.0798 | 12530044 | -0.000406546 | 0.492216 | 19.0416 |
| 3 | 12530038 | 0.490768 | 0.00104102 | 19.0246 | 12530037 | 0.00000 | 0.491809 | 19.0406 |