| Red | Green | Blue | |
| z | 17.64 | ||
| znorm | Inf | ||
| sky | -Inf | -Inf | -Inf |
| S/N | 8.7 | 17.0 | 18.2 |
| S/N(c) | 0.0 | 0.0 | 0.0 |
| SN(E/C) |


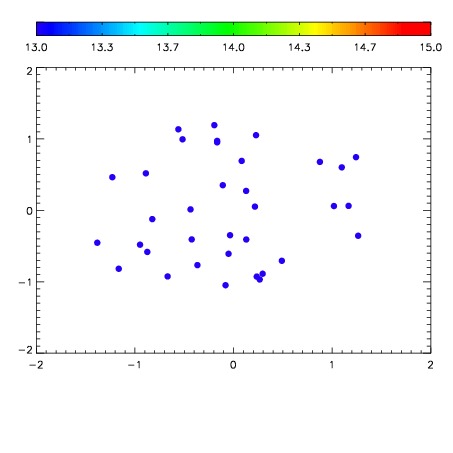

| Frame | Nreads | Zeropoints | Mag plots | Spatial mag deviation | Spatial sky 16325A emission deviations (filled: sky, open: star) | Spatial sky continuum emission | Spatial sky telluric CO2 absorption deviations (filled: H < 10) | |||||||||||||||||||||||
| 0 | 0 |
|
|
|
|
|
|
| IPAIR | NAME | SHIFT | NEWSHIFT | S/N | NAME | SHIFT | NEWSHIFT | S/N |
| 0 | 12540043 | 0.490655 | 0.00000 | 17.5888 | 12540037 | 0.00000 | 0.490655 | 17.5858 |
| 1 | 12540038 | 0.489540 | 0.00111499 | 17.8585 | 12540041 | -0.000319879 | 0.490975 | 17.8617 |
| 2 | 12540039 | 0.489808 | 0.000847012 | 17.8509 | 12540040 | -0.000247216 | 0.490902 | 17.7935 |
| 3 | 12540042 | 0.490469 | 0.000185996 | 16.9162 | 12540044 | -0.00425559 | 0.494911 | 16.3562 |