| Red | Green | Blue | |
| z | 17.64 | ||
| znorm | Inf | ||
| sky | -NaN | -NaN | -Inf |
| S/N | 20.6 | 35.2 | 41.1 |
| S/N(c) | 0.0 | 0.0 | 0.0 |
| SN(E/C) |


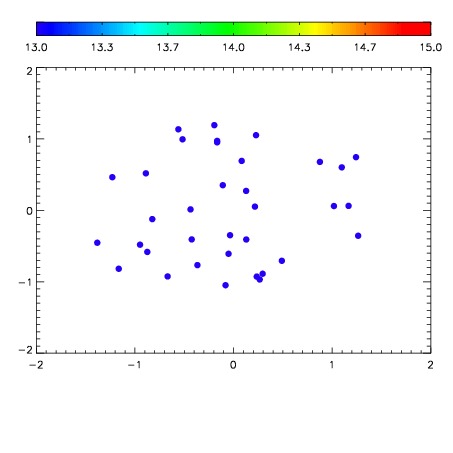

| Frame | Nreads | Zeropoints | Mag plots | Spatial mag deviation | Spatial sky 16325A emission deviations (filled: sky, open: star) | Spatial sky continuum emission | Spatial sky telluric CO2 absorption deviations (filled: H < 10) | |||||||||||||||||||||||
| 0 | 0 |
|
|
|
|
|
|
| IPAIR | NAME | SHIFT | NEWSHIFT | S/N | NAME | SHIFT | NEWSHIFT | S/N |
| 0 | 12550042 | 0.490938 | 0.00000 | 18.8359 | 12550041 | -0.00107351 | 0.492012 | 18.7670 |
| 1 | 12550043 | 0.490379 | 0.000559002 | 18.9076 | 12550044 | -0.00329698 | 0.494235 | 18.8759 |
| 2 | 12550039 | 0.490740 | 0.000198007 | 18.7551 | 12550040 | -0.000959438 | 0.491897 | 18.7143 |
| 3 | 12550038 | 0.490858 | 8.00192e-05 | 18.5656 | 12550037 | 0.00000 | 0.490938 | 18.4532 |