| Red | Green | Blue | |
| z | 17.64 | ||
| znorm | Inf | ||
| sky | -Inf | -NaN | -Inf |
| S/N | 21.6 | 37.4 | 43.8 |
| S/N(c) | 0.0 | 0.0 | 0.0 |
| SN(E/C) |


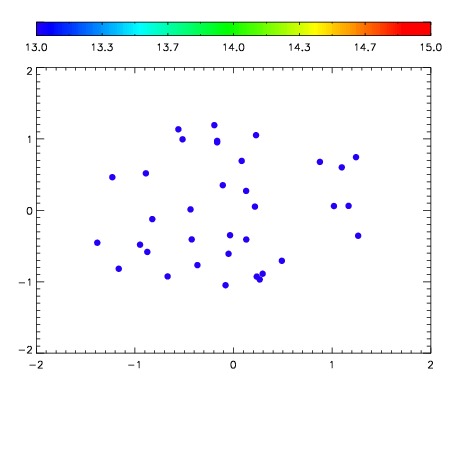

| Frame | Nreads | Zeropoints | Mag plots | Spatial mag deviation | Spatial sky 16325A emission deviations (filled: sky, open: star) | Spatial sky continuum emission | Spatial sky telluric CO2 absorption deviations (filled: H < 10) | |||||||||||||||||||||||
| 0 | 0 |
|
|
|
|
|
|
| IPAIR | NAME | SHIFT | NEWSHIFT | S/N | NAME | SHIFT | NEWSHIFT | S/N |
| 0 | 12560043 | 0.492132 | 0.00000 | 18.8660 | 12560044 | 0.00355347 | 0.488579 | 18.8577 |
| 1 | 12560038 | 0.489088 | 0.00304401 | 19.1479 | 12560037 | 0.00000 | 0.492132 | 19.1269 |
| 2 | 12560042 | 0.492121 | 1.09971e-05 | 18.8344 | 12560041 | -0.00216657 | 0.494299 | 18.6990 |
| 3 | 12560039 | 0.489924 | 0.00220799 | 18.7588 | 12560040 | -0.00214851 | 0.494281 | 18.6068 |