| Red | Green | Blue | |
| z | 17.64 | ||
| znorm | Inf | ||
| sky | -Inf | -NaN | -Inf |
| S/N | 20.8 | 35.3 | 40.3 |
| S/N(c) | 0.0 | 0.0 | 0.0 |
| SN(E/C) |


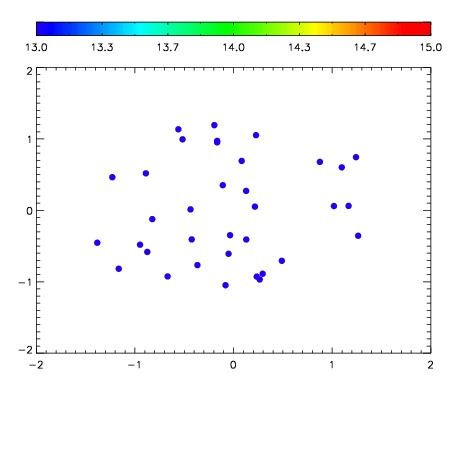

| Frame | Nreads | Zeropoints | Mag plots | Spatial mag deviation | Spatial sky 16325A emission deviations (filled: sky, open: star) | Spatial sky continuum emission | Spatial sky telluric CO2 absorption deviations (filled: H < 10) | |||||||||||||||||||||||
| 0 | 0 |
|
|
|
|
|
|
| IPAIR | NAME | SHIFT | NEWSHIFT | S/N | NAME | SHIFT | NEWSHIFT | S/N |
| 0 | 12570035 | 0.484922 | 0.00000 | 18.0882 | 12570036 | -0.00321216 | 0.488134 | 18.6902 |
| 1 | 12570038 | 0.482340 | 0.00258198 | 19.1466 | 12570040 | -0.00992260 | 0.494845 | 19.1767 |
| 2 | 12570039 | 0.482929 | 0.00199300 | 19.1312 | 12570037 | -0.00410350 | 0.489026 | 19.1253 |
| 3 | 12570034 | 0.484035 | 0.000887007 | 17.3769 | 12570033 | 0.00000 | 0.484922 | 17.6800 |