| Red | Green | Blue | |
| z | 17.63 | ||
| znorm | Inf | ||
| sky | -NaN | -NaN | -Inf |
| S/N | 26.2 | 43.0 | 49.1 |
| S/N(c) | 0.0 | 0.0 | 0.0 |
| SN(E/C) |


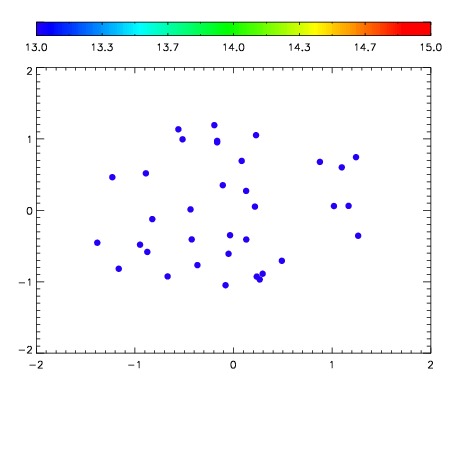

| Frame | Nreads | Zeropoints | Mag plots | Spatial mag deviation | Spatial sky 16325A emission deviations (filled: sky, open: star) | Spatial sky continuum emission | Spatial sky telluric CO2 absorption deviations (filled: H < 10) | |||||||||||||||||||||||
| 0 | 0 |
|
|
|
|
|
|
| IPAIR | NAME | SHIFT | NEWSHIFT | S/N | NAME | SHIFT | NEWSHIFT | S/N |
| 0 | 12580028 | 0.492837 | 0.00000 | 19.1582 | 12580026 | 0.000357977 | 0.492479 | 19.1133 |
| 1 | 12580027 | 0.492180 | 0.000657022 | 19.1425 | 12580029 | 0.00313314 | 0.489704 | 19.1082 |
| 2 | 12580023 | 0.489955 | 0.00288200 | 19.0311 | 12580025 | -0.000710760 | 0.493548 | 19.0669 |
| 3 | 12580024 | 0.491210 | 0.00162700 | 18.9471 | 12580022 | 0.00000 | 0.492837 | 19.0417 |