| Red | Green | Blue | |
| z | 17.64 | ||
| znorm | Inf | ||
| sky | -NaN | -Inf | -Inf |
| S/N | 24.2 | 42.1 | 43.5 |
| S/N(c) | 0.0 | 0.0 | 0.0 |
| SN(E/C) |


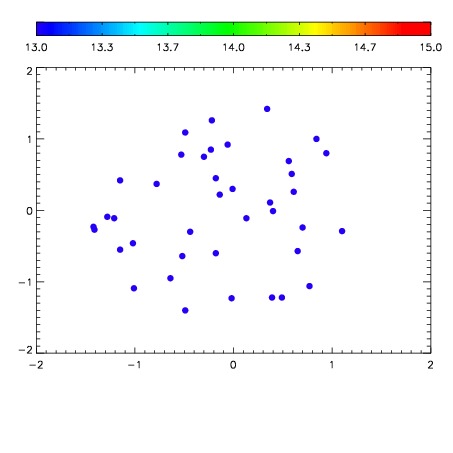

| Frame | Nreads | Zeropoints | Mag plots | Spatial mag deviation | Spatial sky 16325A emission deviations (filled: sky, open: star) | Spatial sky continuum emission | Spatial sky telluric CO2 absorption deviations (filled: H < 10) | |||||||||||||||||||||||
| 0 | 0 |
|
|
|
|
|
|
| IPAIR | NAME | SHIFT | NEWSHIFT | S/N | NAME | SHIFT | NEWSHIFT | S/N |
| 0 | 12720055 | 0.491572 | 0.00000 | 18.9913 | 12720056 | -0.000429440 | 0.492001 | 18.9943 |
| 1 | 12720054 | 0.490576 | 0.000995994 | 18.9686 | 12720049 | 0.00000 | 0.491572 | 18.9328 |
| 2 | 12720050 | 0.487538 | 0.00403398 | 18.9058 | 12720053 | -0.00147033 | 0.493042 | 18.8776 |
| 3 | 12720051 | 0.487164 | 0.00440800 | 18.8877 | 12720052 | -0.00154888 | 0.493121 | 18.8559 |