| Red | Green | Blue | |
| z | 17.64 | ||
| znorm | Inf | ||
| sky | -NaN | -NaN | -Inf |
| S/N | 29.1 | 45.8 | 44.8 |
| S/N(c) | 0.0 | 0.0 | 0.0 |
| SN(E/C) |

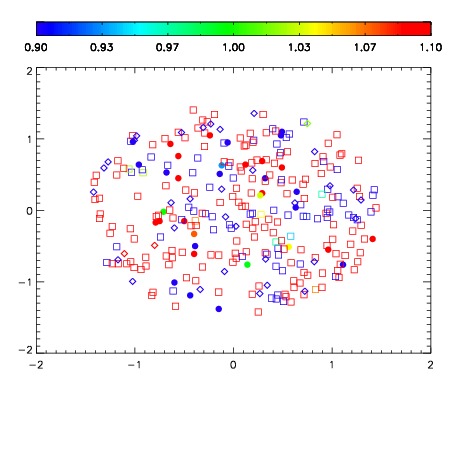
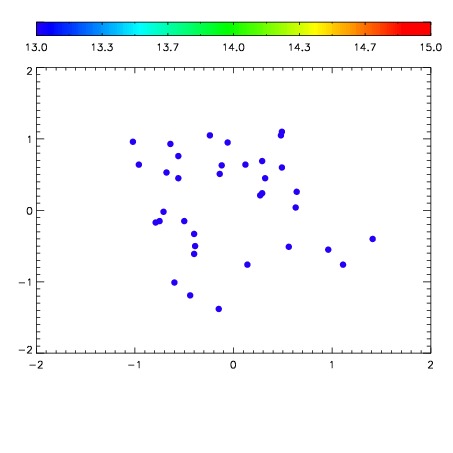

| Frame | Nreads | Zeropoints | Mag plots | Spatial mag deviation | Spatial sky 16325A emission deviations (filled: sky, open: star) | Spatial sky continuum emission | Spatial sky telluric CO2 absorption deviations (filled: H < 10) | |||||||||||||||||||||||
| 0 | 0 |
|
|
|
|
|
|
| IPAIR | NAME | SHIFT | NEWSHIFT | S/N | NAME | SHIFT | NEWSHIFT | S/N |
| 0 | 12580039 | 0.492181 | 0.00000 | 18.9551 | 12580037 | 0.000846631 | 0.491334 | 18.9398 |
| 1 | 12580035 | 0.491426 | 0.000755012 | 19.1442 | 12580040 | 0.00148572 | 0.490695 | 19.1353 |
| 2 | 12580034 | 0.490714 | 0.00146699 | 19.1198 | 12580036 | 9.42338e-05 | 0.492087 | 19.0968 |
| 3 | 12580038 | 0.490934 | 0.00124699 | 19.0698 | 12580033 | 0.00000 | 0.492181 | 19.0960 |