| Red | Green | Blue | |
| z | 17.64 | ||
| znorm | Inf | ||
| sky | -Inf | -Inf | -Inf |
| S/N | 26.2 | 44.4 | 47.4 |
| S/N(c) | 0.0 | 0.0 | 0.0 |
| SN(E/C) |
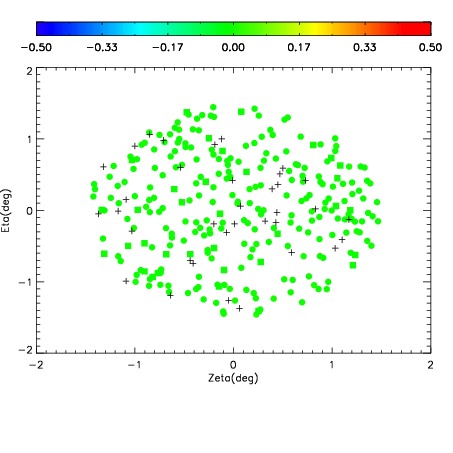
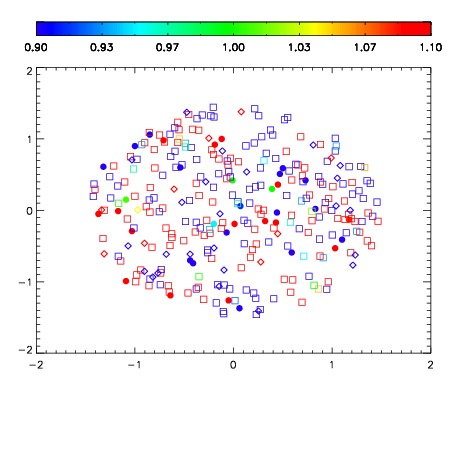


| Frame | Nreads | Zeropoints | Mag plots | Spatial mag deviation | Spatial sky 16325A emission deviations (filled: sky, open: star) | Spatial sky continuum emission | Spatial sky telluric CO2 absorption deviations (filled: H < 10) | |||||||||||||||||||||||
| 0 | 0 |
|
|
|
|
|
|
| IPAIR | NAME | SHIFT | NEWSHIFT | S/N | NAME | SHIFT | NEWSHIFT | S/N |
| 0 | 12670028 | 0.489496 | 0.00000 | 18.6948 | 12670022 | 0.00000 | 0.489496 | 18.8422 |
| 1 | 12670023 | 0.489093 | 0.000402987 | 18.9515 | 12670026 | 3.19449e-05 | 0.489464 | 19.1612 |
| 2 | 12670024 | 0.488436 | 0.00105998 | 18.9487 | 12670025 | -5.21094e-05 | 0.489548 | 19.1357 |
| 3 | 12670027 | 0.488677 | 0.000818998 | 18.9155 | 12670029 | 0.000227278 | 0.489269 | 19.0065 |