| Red | Green | Blue | |
| z | 17.64 | ||
| znorm | Inf | ||
| sky | -Inf | -Inf | -NaN |
| S/N | 18.7 | 31.4 | 31.9 |
| S/N(c) | 0.0 | 0.0 | 0.0 |
| SN(E/C) |


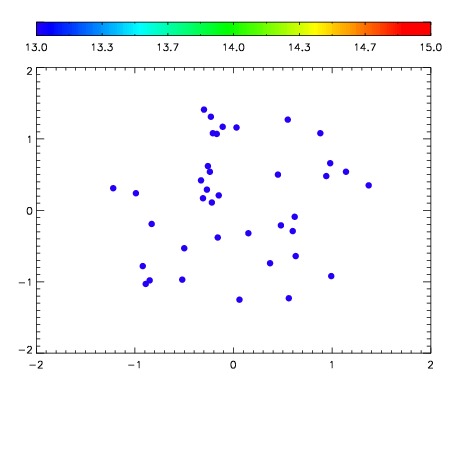

| Frame | Nreads | Zeropoints | Mag plots | Spatial mag deviation | Spatial sky 16325A emission deviations (filled: sky, open: star) | Spatial sky continuum emission | Spatial sky telluric CO2 absorption deviations (filled: H < 10) | |||||||||||||||||||||||
| 0 | 0 |
|
|
|
|
|
|
| IPAIR | NAME | SHIFT | NEWSHIFT | S/N | NAME | SHIFT | NEWSHIFT | S/N |
| 0 | 12590034 | 0.496229 | 0.00000 | 18.7659 | 12590035 | 0.00190515 | 0.494324 | 18.7576 |
| 1 | 12590033 | 0.494540 | 0.00168899 | 18.6058 | 12590031 | 0.000501809 | 0.495727 | 18.6809 |
| 2 | 12590030 | 0.489971 | 0.00625798 | 18.5572 | 12590032 | 0.00144518 | 0.494784 | 18.6744 |
| 3 | 12590029 | 0.488701 | 0.00752801 | 18.4379 | 12590028 | 0.00000 | 0.496229 | 18.2237 |