| Red | Green | Blue | |
| z | 17.64 | ||
| znorm | Inf | ||
| sky | -NaN | -Inf | -NaN |
| S/N | 22.7 | 38.2 | 36.7 |
| S/N(c) | 0.0 | 0.0 | 0.0 |
| SN(E/C) |

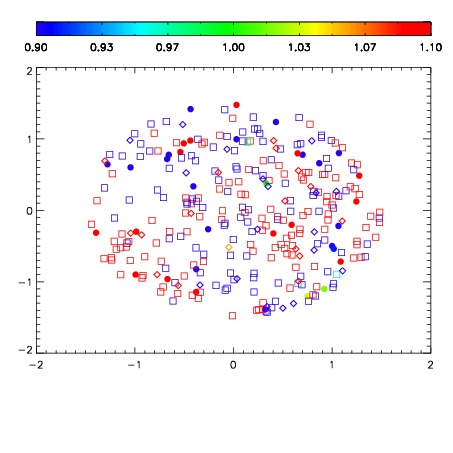
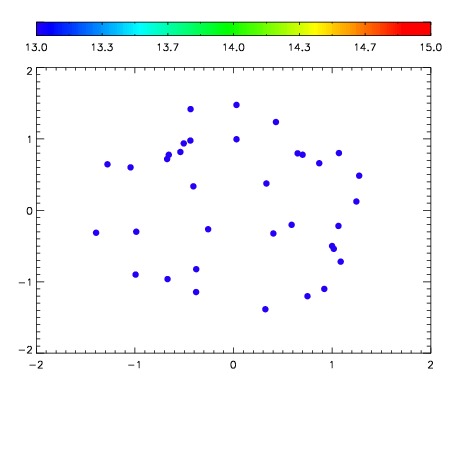

| Frame | Nreads | Zeropoints | Mag plots | Spatial mag deviation | Spatial sky 16325A emission deviations (filled: sky, open: star) | Spatial sky continuum emission | Spatial sky telluric CO2 absorption deviations (filled: H < 10) | |||||||||||||||||||||||
| 0 | 0 |
|
|
|
|
|
|
| IPAIR | NAME | SHIFT | NEWSHIFT | S/N | NAME | SHIFT | NEWSHIFT | S/N |
| 0 | 11870094 | 0.498933 | 0.00000 | 18.6459 | 11870092 | 0.00000 | 0.498933 | 18.6145 |
| 1 | 11870097 | 0.496015 | 0.00291798 | 18.8817 | 11870099 | -0.000990585 | 0.499924 | 18.7476 |
| 2 | 11870098 | 0.496678 | 0.00225499 | 18.8479 | 11870096 | -0.00264293 | 0.501576 | 18.7246 |
| 3 | 11870093 | 0.498149 | 0.000783980 | 18.6437 | 11870095 | -0.00171169 | 0.500645 | 18.5415 |