| Red | Green | Blue | |
| z | 17.64 | ||
| znorm | Inf | ||
| sky | -Inf | -Inf | -Inf |
| S/N | 20.6 | 37.7 | 39.0 |
| S/N(c) | 0.0 | 0.0 | 0.0 |
| SN(E/C) |
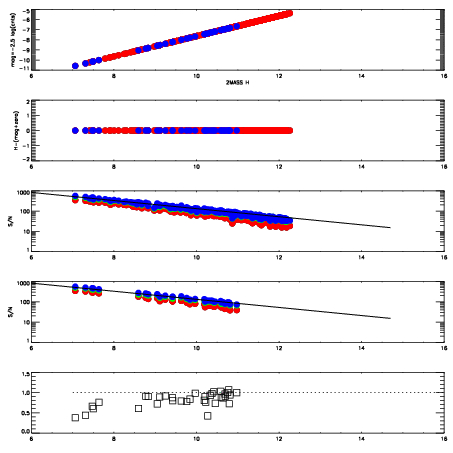
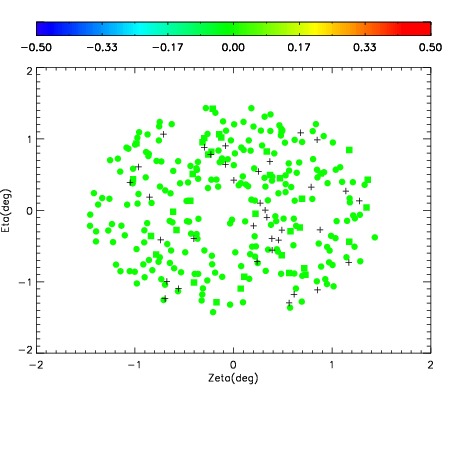
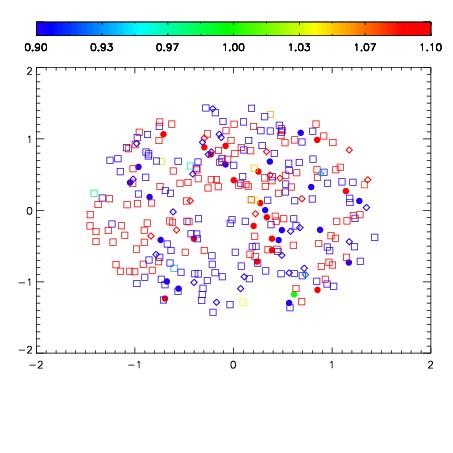


| Frame | Nreads | Zeropoints | Mag plots | Spatial mag deviation | Spatial sky 16325A emission deviations (filled: sky, open: star) | Spatial sky continuum emission | Spatial sky telluric CO2 absorption deviations (filled: H < 10) | |||||||||||||||||||||||
| 0 | 0 |
|
|
|
|
|
|
| IPAIR | NAME | SHIFT | NEWSHIFT | S/N | NAME | SHIFT | NEWSHIFT | S/N |
| 0 | 12460012 | 0.498282 | 0.00000 | 18.4036 | 12460014 | -0.00235036 | 0.500632 | 18.4465 |
| 1 | 12460019 | 0.492797 | 0.00548500 | 18.7304 | 12460018 | -0.00226686 | 0.500549 | 18.6602 |
| 2 | 12460015 | 0.494186 | 0.00409597 | 18.4770 | 12460017 | -0.00157192 | 0.499854 | 18.5176 |
| 3 | 12460011 | 0.497583 | 0.000698984 | 18.3725 | 12460013 | -0.00208241 | 0.500364 | 18.3776 |
| 4 | 12460016 | 0.495127 | 0.00315499 | 18.2305 | 12460010 | 0.00000 | 0.498282 | 18.3488 |