| Red | Green | Blue | |
| z | 17.64 | ||
| znorm | Inf | ||
| sky | -Inf | -NaN | -Inf |
| S/N | 25.9 | 36.8 | 38.2 |
| S/N(c) | 0.0 | 0.0 | 0.0 |
| SN(E/C) |
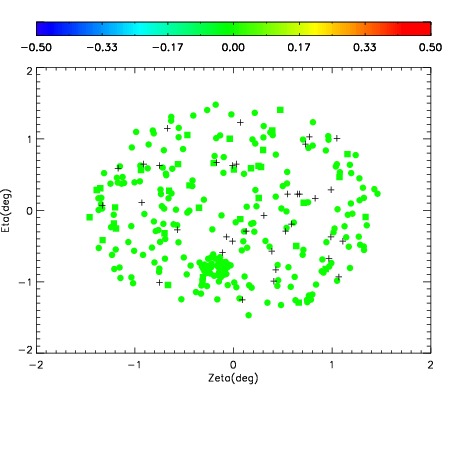
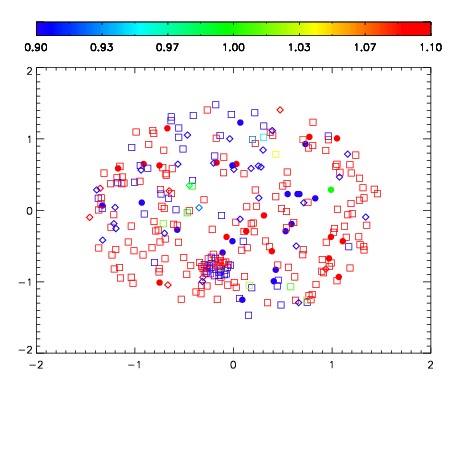
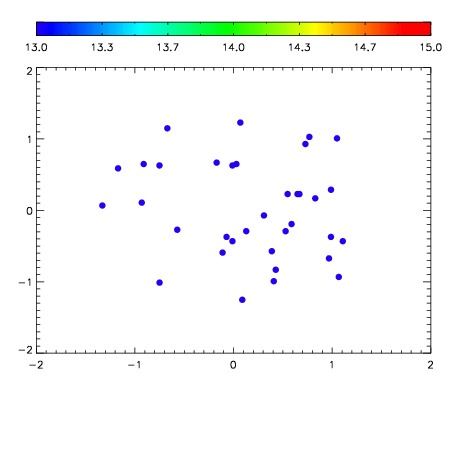

| Frame | Nreads | Zeropoints | Mag plots | Spatial mag deviation | Spatial sky 16325A emission deviations (filled: sky, open: star) | Spatial sky continuum emission | Spatial sky telluric CO2 absorption deviations (filled: H < 10) | |||||||||||||||||||||||
| 0 | 0 |
|
|
|
|
|
|
| IPAIR | NAME | SHIFT | NEWSHIFT | S/N | NAME | SHIFT | NEWSHIFT | S/N |
| 0 | 12310061 | 0.493858 | 0.00000 | 18.7640 | 12310062 | -0.000627424 | 0.494485 | 18.5594 |
| 1 | 12310060 | 0.493663 | 0.000194997 | 18.8406 | 12310059 | -0.000952830 | 0.494811 | 18.8983 |
| 2 | 12310057 | 0.493055 | 0.000803024 | 18.8169 | 12310058 | -0.000994787 | 0.494853 | 18.8823 |
| 3 | 12310056 | 0.492603 | 0.00125501 | 18.8091 | 12310055 | 0.00000 | 0.493858 | 18.7455 |