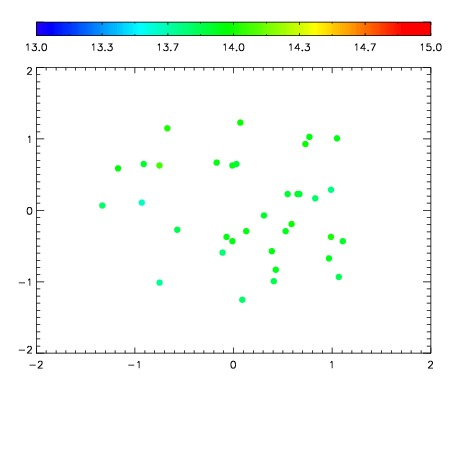
| Frame | Nreads | Zeropoints | Mag plots
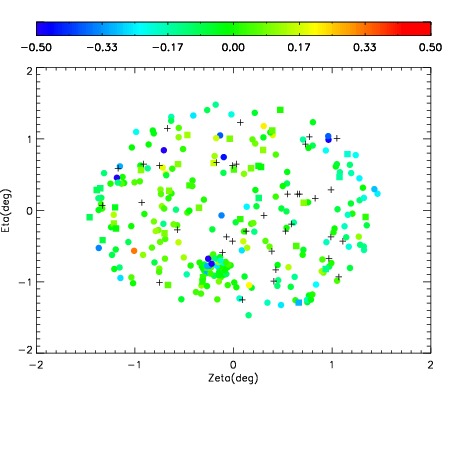
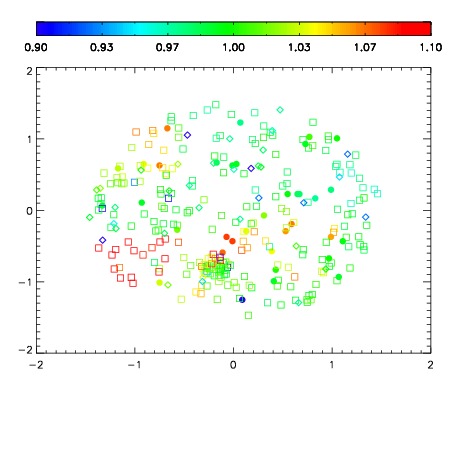
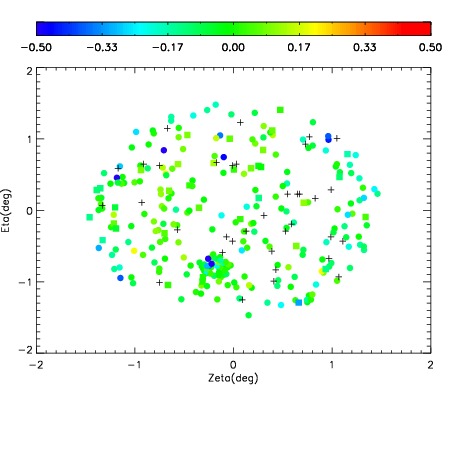
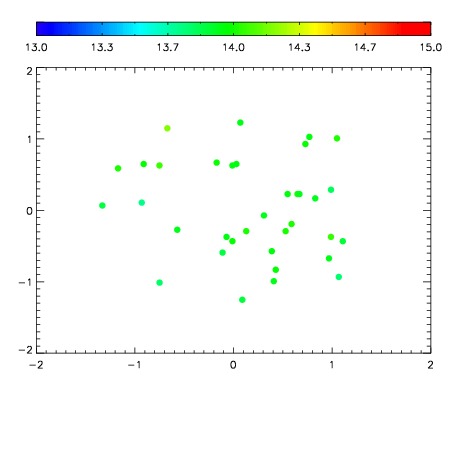
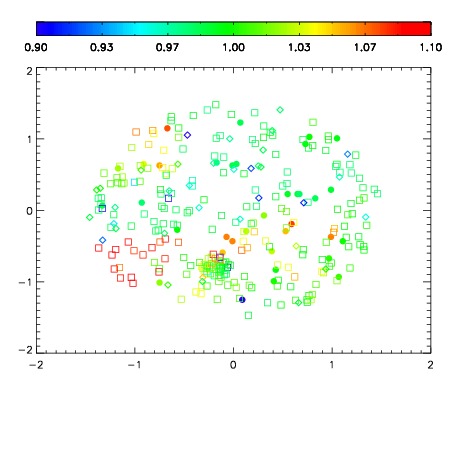
| Spatial mag deviation
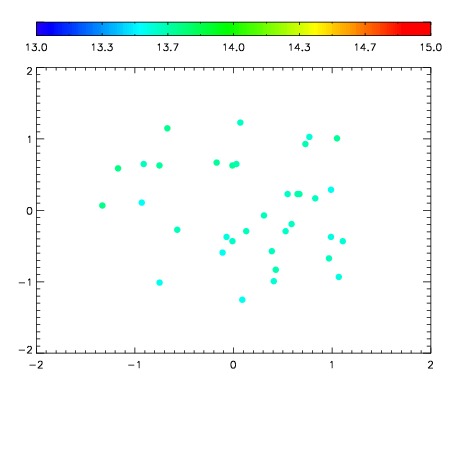
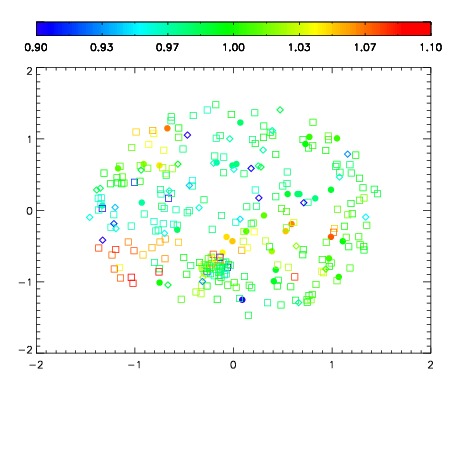
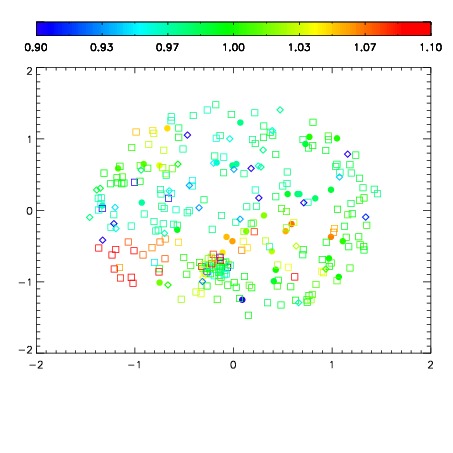
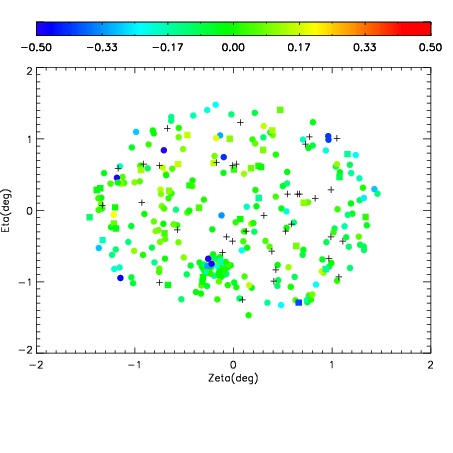
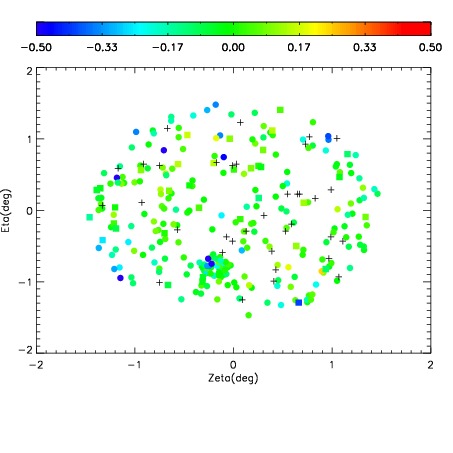
| Spatial sky 16325A emission deviations (filled: sky, open: star)
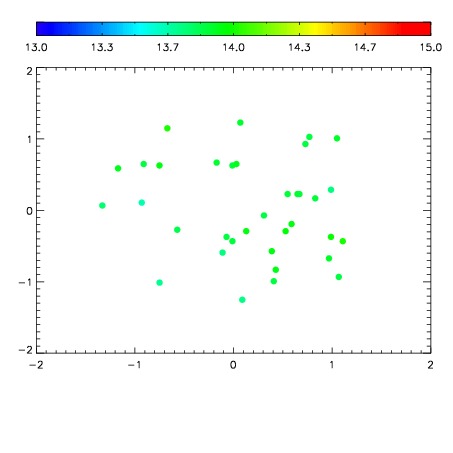
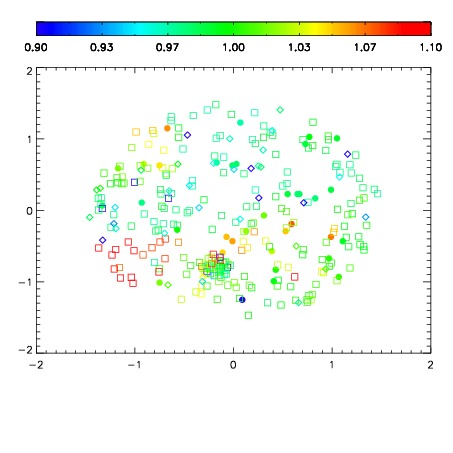
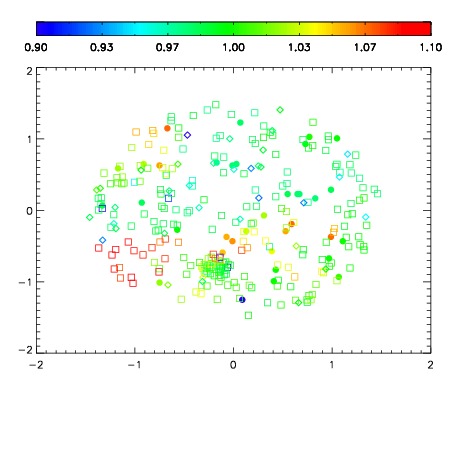
| Spatial sky continuum emission
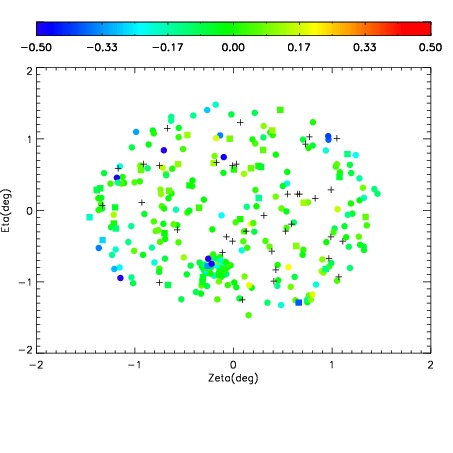
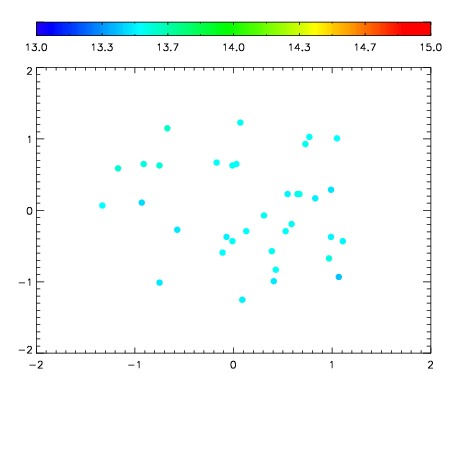
| Spatial sky telluric CO2 absorption deviations (filled: H < 10)
|
| 12350024
| 47
| | Red | Green | Blue
| | z | | 18.37
| | znorm | | 14.19
| | sky | 13.7 | 13.6 | 13.6
| | S/N | 9.9 | 15.6 | 15.1
| | S/N(c) | 22.5 | 19.8 | 40.2
| | SN(E/C) 0.96
|
| 
| 
| 
| 
| 
|
| 12350025
| 47
| | Red | Green | Blue
| | z | | 18.51
| | znorm | | 14.33
| | sky | 13.8 | 13.8 | 13.9
| | S/N | 10.8 | 17.3 | 17.0
| | S/N(c) | 23.9 | 21.0 | 45.0
| | SN(E/C) 0.91
|
| 
| 
| 
| 
| 
|
| 12350026
| 47
| | Red | Green | Blue
| | z | | 18.73
| | znorm | | 14.55
| | sky | 13.9 | 13.9 | 14.1
| | S/N | 13.1 | 20.3 | 20.0
| | S/N(c) | 27.1 | 23.1 | 51.1
| | SN(E/C) 0.91
|
| 
| 
| 
| 
| 
|
| 12350027
| 47
| | Red | Green | Blue
| | z | | 18.44
| | znorm | | 14.26
| | sky | 13.9 | 13.8 | 13.9
| | S/N | 10.2 | 16.5 | 16.3
| | S/N(c) | 22.8 | 19.7 | 44.2
| | SN(E/C) 0.93
|
| 
| 
| 
| 
| 
|
| 12350028
| 47
| | Red | Green | Blue
| | z | | 18.71
| | znorm | | 14.53
| | sky | 13.9 | 13.9 | 14.0
| | S/N | 12.3 | 20.0 | 20.0
| | S/N(c) | 27.6 | 23.4 | 51.6
| | SN(E/C) 0.89
|
| 
| 
| 
| 
| 
|
| 12350029
| 47
| | Red | Green | Blue
| | z | | 18.92
| | znorm | | 14.74
| | sky | 14.3 | 14.1 | 14.3
| | S/N | 14.7 | 22.9 | 22.9
| | S/N(c) | 30.7 | 25.8 | 56.3
| | SN(E/C) 0.89
|
| 
| 
| 
| 
| 
|
| 12350030
| 47
| | Red | Green | Blue
| | z | | 18.66
| | znorm | | 14.48
| | sky | 13.9 | 13.9 | 14.0
| | S/N | 12.0 | 19.1 | 19.4
| | S/N(c) | 26.2 | 22.8 | 49.0
| | SN(E/C) 0.90
|
| 
| 
| 
| 
| 
|
| 12350031
| 47
| | Red | Green | Blue
| | z | | 18.33
| | znorm | | 14.15
| | sky | 13.7 | 13.7 | 13.8
| | S/N | 9.6 | 15.1 | 15.4
| | S/N(c) | 21.6 | 19.4 | 41.5
| | SN(E/C) 0.91
|
| 
| 
| 
| 
| 
|
| 12350032
| 47
| | Red | Green | Blue
| | z | | 18.24
| | znorm | | 14.06
| | sky | 13.6 | 13.6 | 13.8
| | S/N | 8.6 | 14.3 | 13.9
| | S/N(c) | 19.4 | 17.9 | 38.6
| | SN(E/C) 0.97
|
| 
| 
| 
| 
| 
|
| 12350033
| 47
| | Red | Green | Blue
| | z | | 17.97
| | znorm | | 13.79
| | sky | 13.5 | 13.5 | 13.6
| | S/N | 7.0 | 11.7 | 11.2
| | S/N(c) | 16.5 | 15.7 | 33.5
| | SN(E/C) 0.96
|
| 
| 
| 
| 
| 
|