| Red | Green | Blue | |
| z | 17.64 | ||
| znorm | Inf | ||
| sky | -Inf | -Inf | -NaN |
| S/N | 21.5 | 34.6 | 35.4 |
| S/N(c) | 0.0 | 0.0 | 0.0 |
| SN(E/C) |
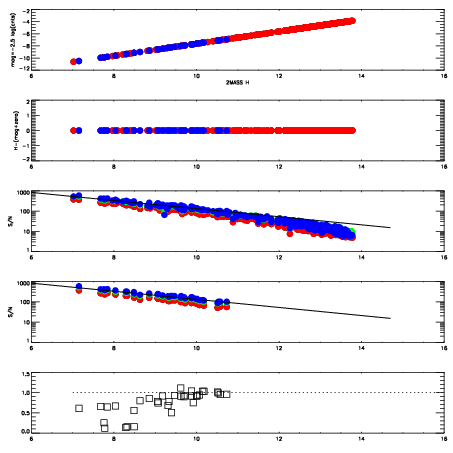
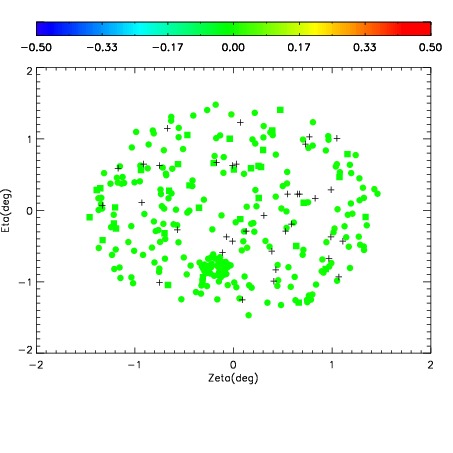
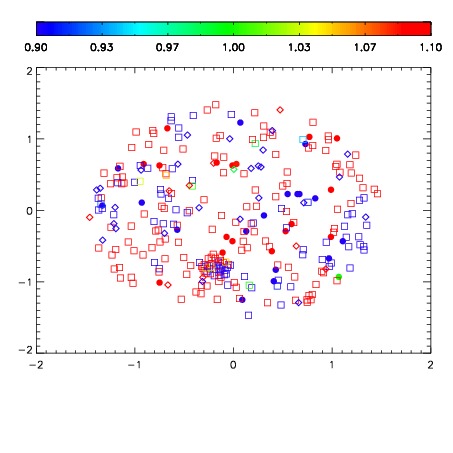
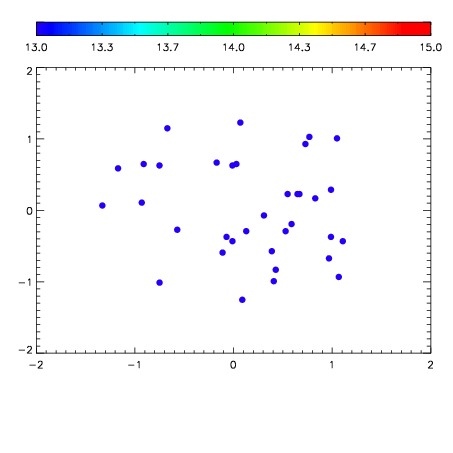

| Frame | Nreads | Zeropoints | Mag plots | Spatial mag deviation | Spatial sky 16325A emission deviations (filled: sky, open: star) | Spatial sky continuum emission | Spatial sky telluric CO2 absorption deviations (filled: H < 10) | |||||||||||||||||||||||
| 0 | 0 |
|
|
|
|
|
|
| IPAIR | NAME | SHIFT | NEWSHIFT | S/N | NAME | SHIFT | NEWSHIFT | S/N |
| 0 | 12350030 | 0.494862 | 0.00000 | 18.6347 | 12350024 | 0.00000 | 0.494862 | 18.3517 |
| 1 | 12350029 | 0.493873 | 0.000988990 | 18.8938 | 12350028 | 0.00180335 | 0.493059 | 18.6903 |
| 2 | 12350026 | 0.492295 | 0.00256699 | 18.7088 | 12350027 | 0.00182299 | 0.493039 | 18.4142 |
| 3 | 12350025 | 0.491743 | 0.00311899 | 18.4819 | 12350031 | -0.00159205 | 0.496454 | 18.3011 |
| 4 | 12350033 | 0.493810 | 0.00105199 | 17.9423 | 12350032 | -0.00166649 | 0.496528 | 18.2052 |