| Red | Green | Blue | |
| z | 17.64 | ||
| znorm | Inf | ||
| sky | -NaN | -NaN | -NaN |
| S/N | 25.9 | 42.3 | 43.7 |
| S/N(c) | 0.0 | 0.0 | 0.0 |
| SN(E/C) |


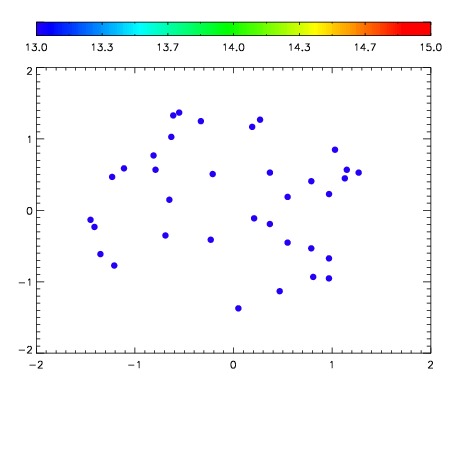

| Frame | Nreads | Zeropoints | Mag plots | Spatial mag deviation | Spatial sky 16325A emission deviations (filled: sky, open: star) | Spatial sky continuum emission | Spatial sky telluric CO2 absorption deviations (filled: H < 10) | |||||||||||||||||||||||
| 0 | 0 |
|
|
|
|
|
|
| IPAIR | NAME | SHIFT | NEWSHIFT | S/N | NAME | SHIFT | NEWSHIFT | S/N |
| 0 | 12230050 | 0.494858 | 0.00000 | 18.9185 | 12230055 | 4.73474e-05 | 0.494811 | 18.9359 |
| 1 | 12230053 | 0.494055 | 0.000802994 | 18.9053 | 12230051 | 0.000359648 | 0.494498 | 18.9253 |
| 2 | 12230049 | 0.494418 | 0.000440001 | 18.8954 | 12230052 | 7.87835e-05 | 0.494779 | 18.9188 |
| 3 | 12230054 | 0.493796 | 0.00106201 | 18.8474 | 12230048 | 0.00000 | 0.494858 | 18.8810 |