| Red | Green | Blue | |
| z | 17.64 | ||
| znorm | Inf | ||
| sky | -Inf | -Inf | -Inf |
| S/N | 25.7 | 42.8 | 43.3 |
| S/N(c) | 0.0 | 0.0 | 0.0 |
| SN(E/C) |
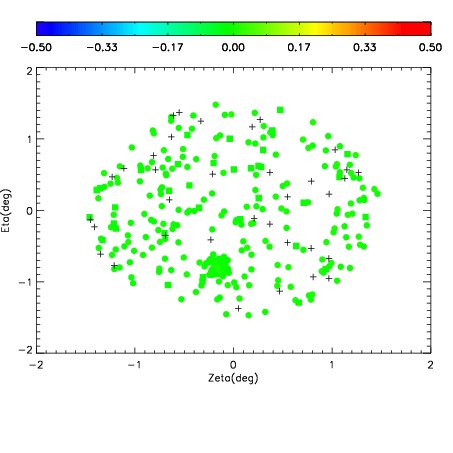
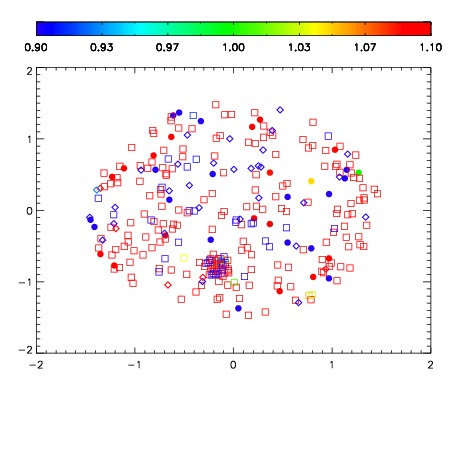
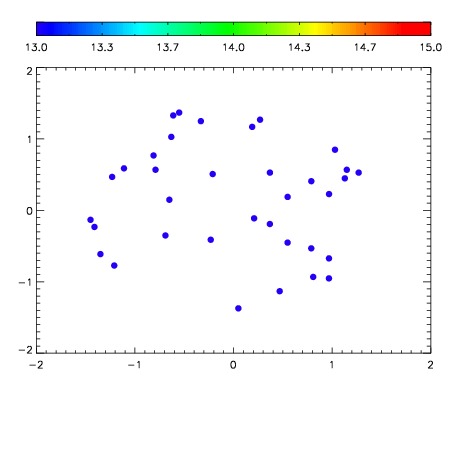

| Frame | Nreads | Zeropoints | Mag plots | Spatial mag deviation | Spatial sky 16325A emission deviations (filled: sky, open: star) | Spatial sky continuum emission | Spatial sky telluric CO2 absorption deviations (filled: H < 10) | |||||||||||||||||||||||
| 0 | 0 |
|
|
|
|
|
|
| IPAIR | NAME | SHIFT | NEWSHIFT | S/N | NAME | SHIFT | NEWSHIFT | S/N |
| 0 | 12520050 | 0.493728 | 0.00000 | 18.7837 | 12520047 | -0.00160364 | 0.495332 | 18.7793 |
| 1 | 12520049 | 0.492756 | 0.000972003 | 18.8647 | 12520051 | -4.87309e-05 | 0.493777 | 18.9112 |
| 2 | 12520046 | 0.489763 | 0.00396502 | 18.8101 | 12520048 | -0.000462019 | 0.494190 | 18.8372 |
| 3 | 12520045 | 0.489440 | 0.00428802 | 18.6728 | 12520044 | 0.00000 | 0.493728 | 18.7374 |